Figure 4.
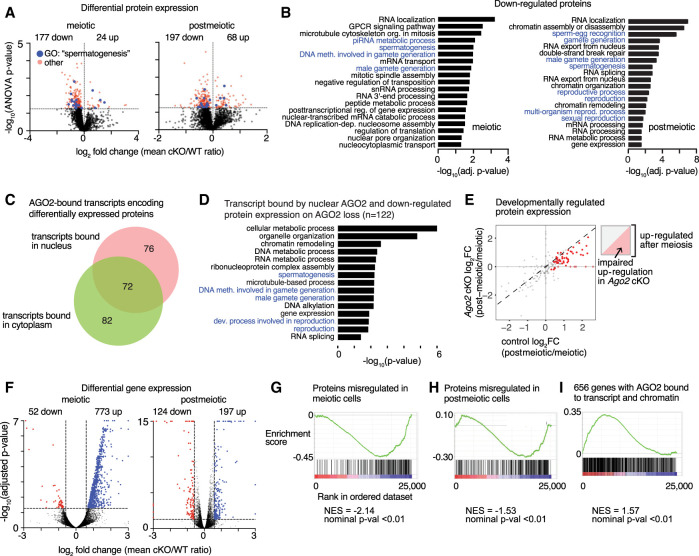
AGO2 regulates protein and transcript expression of male reproduction-related genes. (A) Volcano plots showing protein level changes in meiotic and postmeiotic male germ cells from Ago2 cKO animals. Statistically significant differentially expressed proteins (P ≤ 0.05) are shown by a dashed line and are highlighted in red. Differentially expressed proteins belonging to the GO category “spermatogenesis” (GO:0007283) are highlighted in blue. (B) Enriched GO terms associated with down-regulated proteins in Ago2 cKO meiotic and postmeiotic cells. GO terms related to male fertility are highlighted in blue. (C) Distribution of transcripts encoding differentially expressed proteins bound by AGO2 in nucleus, cytoplasm, or both. (D) Selected enriched GO terms for the set of genes with reduced protein expression in the Ago2 cKO and transcripts bound by AGO2 in meiotic or postmeiotic nuclei. (E) Changes in protein expression of meiotic AGO2 CLIP targets between meiotic and postmeiotic stages. Statistically significantly up-regulated proteins are in red. Cartoon plot illustrates that proteins in the upper right quadrant are up-regulated at postmeiotic stages, and up-regulation is attenuated in Ago2 cKO for proteins below the diagonal. (F) Volcano plots showing global transcriptional changes in Ago2 cKO male germ cells at meiotic (left) and postmeiotic (right) stages. Transcripts with log2 fold change ≤1.5 or ≥1.5 and adjusted P-value ≤ 0.05 are demarcated by dashed lines and highlighted in blue (up-regulated) or red (down-regulated). (G–I) Gene set enrichment analysis (GSEA) for differentially expressed transcripts relative to the set of proteins differentially expressed in meiotic cells (G), the set of proteins differentially expressed in postmeiotic cells (H), or genes for which AGO2 interacts with both chromatin and nuclear transcripts (I) (as shown in Fig. 3J).

