Figure 5.
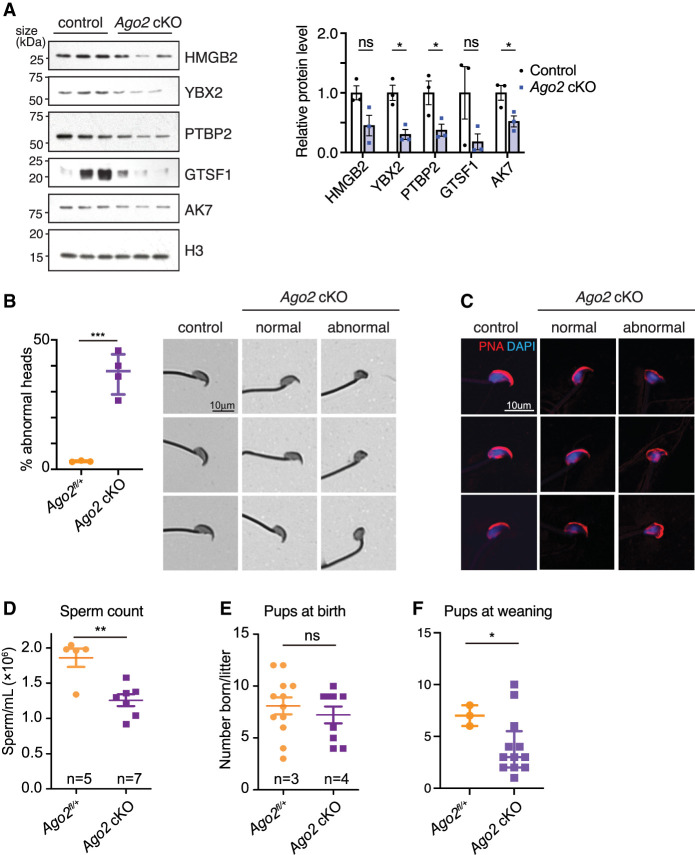
Loss of AGO2 impairs expression of proteins required for normal sperm production and results in oligospermia and abnormal sperm head morphology. (A) Western blot validation of spermiogenesis protein down-regulation. Bar chart shows levels of each protein relative to histone H3, quantified using densitometric analysis for three biological replicates per group. Error bars, SEM; (ns) not statistically significant, (*) P ≤ 0.05, Welch's t-test. (B, left) Percentage of Ago2 cKO spermatozoa with abnormal heads, representing n > 400 spermatozoa from each of three to four biological replicates. Points represent mean of each replicate, and bars show median and interquartile range of all replicates. (***) P < 0.001, Welch's t-test. (Right) Brightfield images of spermatozoa stained with Coomassie blue, showing representative cells collected from control and Ago2 cKO cauda epididymides. Both normal and abnormal examples of Ago2 cKO sperm are shown. (C) Representative spermatozoa stained with fluorophore-conjugated lectin-peanut agglutinin to visualize the acrosome (red) and DAPI to show DNA (blue). Both normal and abnormal examples of Ago2 cKO sperm are shown. (D) Epididymal sperm count in Ago2 cKO males and littermate controls. (E,F) Fertility in Ago2 cKO males and littermate controls, assessed as number of pups at birth (E) or at weaning (F). Error bars, SD; (*) P < 0.05, (**) P < 0.01, (***) P < 0.005, Welch's t-test.

