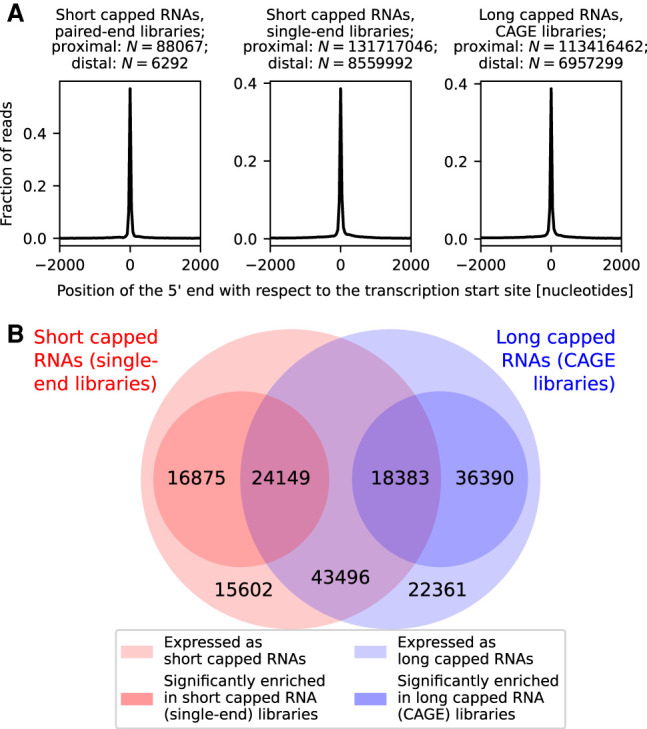
Figure 2.

Gene-associated short and long capped RNAs. (A) Position of the 5′ end of short and long capped RNAs, associated in the sense orientation with annotated genes, relative to the transcription start site of the gene. (B) Venn diagram of transcription initiation peaks associated with genes in the sense orientation. The outer circles represent peaks expressing short capped RNAs (red outer circle) and long capped RNAs (blue outer circle). The inner circles represent peaks with a significantly higher expression of short capped RNAs than long capped RNAs (red inner circle) or a significantly higher expression of long capped RNAs than short capped RNAs (blue inner circle).
