Figure 3.
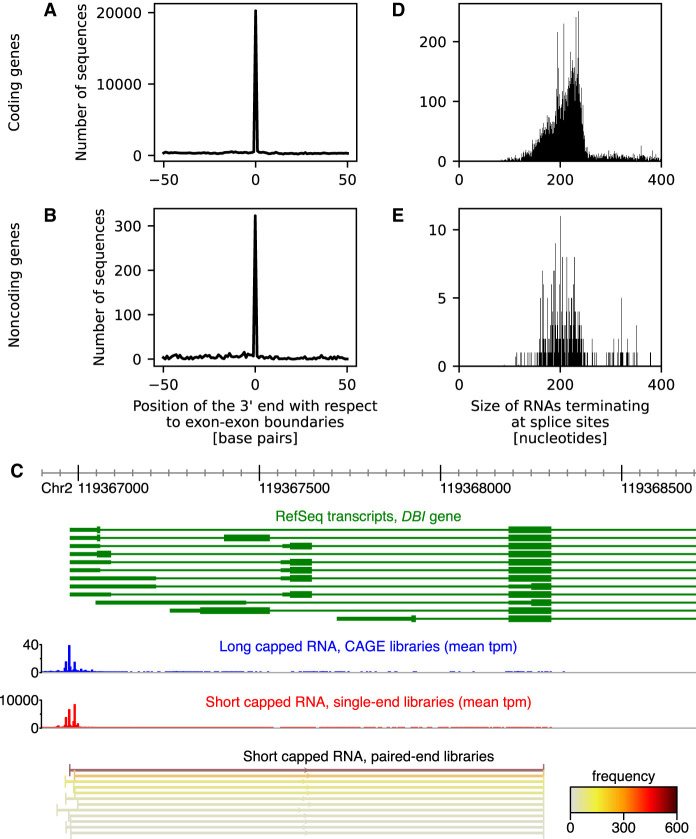
Position of the 3′ end of short capped RNAs aligning to coding (A) or noncoding (B) genes, relative to their splice sites. (C) 5′ Region of the diazepam binding inhibitor, acyl-CoA binding protein (DBI) gene. RefSeq transcripts associated with the DBI gene are shown in green. The position of the 5′ end of long capped RNAs is shown in blue as an expression histogram of the mean number of tags per million (tpm) observed in the CAGE libraries; the position of the 5′ end of short capped RNAs is shown in red as an expression histogram of the mean number of tpm observed in the single-end libraries. The 5′ and 3′ end of short capped RNAs aligning to the mature mRNA, colored by total read frequency, as observed in the paired-end libraries at the bottom (only the top expressed RNAs are shown), revealing that the short capped RNAs terminated at one specific position within an exon of DBI. (D) Size of short capped RNAs terminating at splice sites of coding genes. (E) Size of short capped RNAs terminating at splice sites of noncoding genes.

