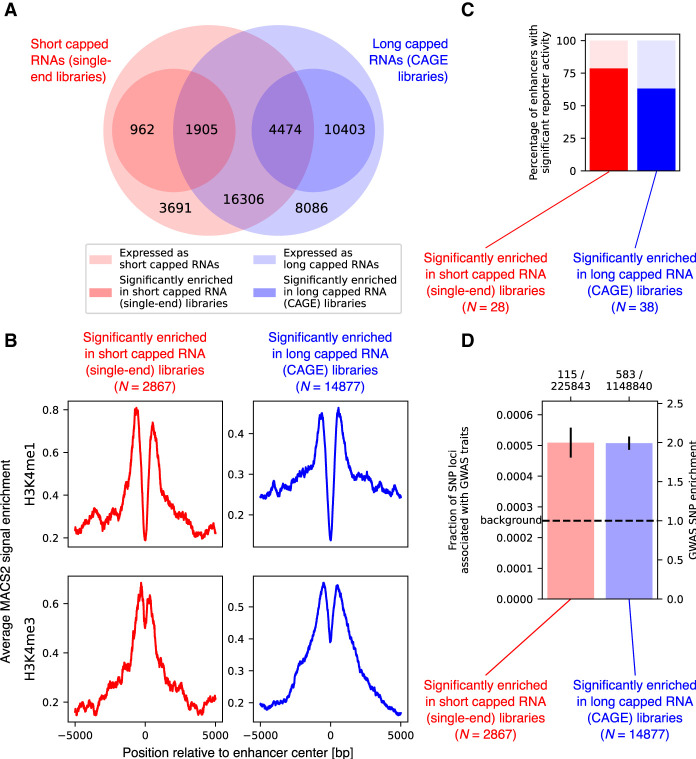
Figure 4.
Enhancer expression of short and long capped RNAs. (A) Venn diagram of predicted enhancers. The outer circles represent predicted enhancers expressing short capped RNAs (red outer circle) and long capped RNAs (blue outer circle). The inner circles represent predicted enhancers significantly enriched for short capped RNAs expression (red inner circle) or for long capped RNA expression (blue inner circle). (B) Reporter activity of predicted enhancers with enriched for expression of short or long capped RNAs. (C) H3K4me1 and H3K4me3 epigenetic marker signal for enhancers and active promoters, respectively, at promoters enriched for short or long capped RNAs. (D) Fraction of SNP loci associated with GWAS traits overlapping predicted enhancers enriched for short or long capped RNA expression; error bars indicate the standard deviation of the fraction. The number of GWAS-associated SNP loci and the total number of SNP loci are shown as a ratio above the graph. The dashed line shows the genome-wide fraction of SNP loci associated with GWAS traits as the background level.

