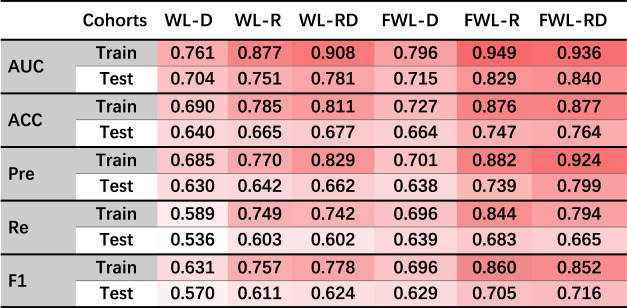
TABLE 2.
The average model performance in the training and testing cohorts using six feature sets of WL-D, WL-R, WL-RD, FWL-D, FWL-R, FWL-RD. The dark red color represents higher values.

|
AUC, area under the receiver operator characteristic curve; ACC, accuracy; Pre, Precision; Re, Recall; F1, F1-score.
