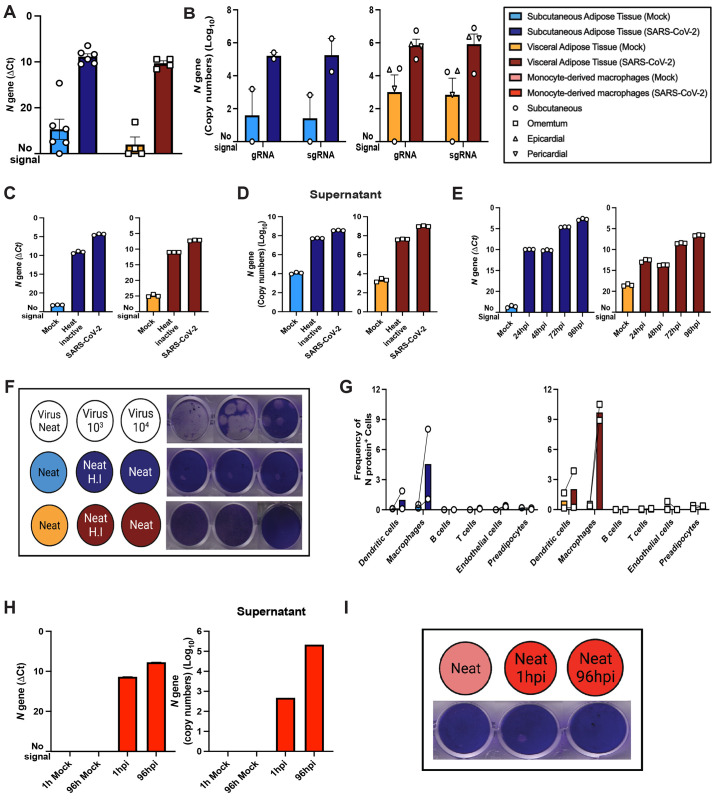
Fig. 3. Exposure of stromal vascular cells from adipose tissue to SARS-CoV-2 leads to abortive infection in adipose tissue macrophages.
Stromal vascular cells (SVC) from fresh human adipose tissue was infected with SARS-CoV-2 (USA-WA1/2020) at an MOI of 1 or mock-infected, and SARS-CoV-2 N gene expression was obtained by 1-step RTqPCR. (A) N gene ΔCt at 24hpi or mock (subcutaneous, n=6; visceral, n=4), and (B) absolute gene copy numbers of genomic (gRNA) and subgenomic (sgRNA) viral RNA at 24hpi (subcutaneous, n=2; visceral, n=4) are shown. (C and D) N gene detection on SVC exposed to SARS-CoV-2, heat inactivated SARS-CoV-2, or mock for 96hpi are reported as N gene ΔCt for cells (C) or N-gene absolute copy numbers for supernatant (D). (E) N gene ΔCt was measured in infected or mock SVC that were maintained for 24, 48, 72, and 96hpi before RNA isolation. (F) Plaque assay results are shown for neat (undiluted) and diluted viral stock (top) or neat (undiluted) supernatants collected from subcutaneous (middle, blue) or visceral (bottom, red) adipose tissue SVC from mock (left, light colors), heat inactivated SARS-CoV-2 (middle, dark colors), or SARS-CoV-2 (left, dark colors) conditions. (G) Frequency of SARS-CoV-2 infected cells is shown based on SARS-CoV-2 N protein detection by flow cytometry of subcutaneous (n=2) and visceral (n=2) adipose tissue. Paired samples are connected by mock (left) and infected (right). (H) N gene measurements are shown for cells (left) and supernatant (right) from monocyte-derived macrophages (MDMs) infected with SARS-CoV-2 for 1hpi, 96hpi, or mock. (I) Plaque assay results are shown for neat supernatant from mock infected (left, light red), and SARS-CoV-2 infected MDMs for 1 hour (middle, dark red), and 96 hours (right, dark red). Data are presented as mean ± s.e.m., except in (D) and (H, right), where data are presented in geometric means. The color legend on the top right applies to all subfigures.

