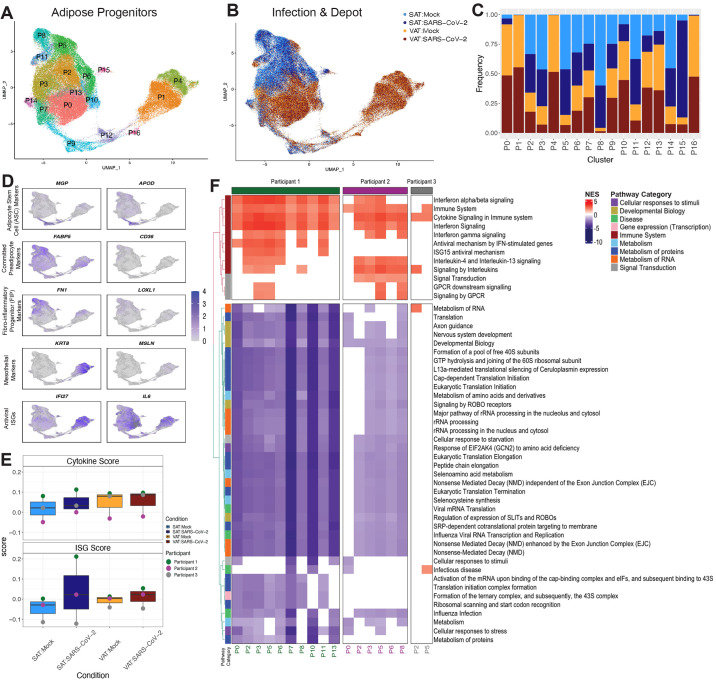
Fig. 6. Preadipocytes respond to SARS-CoV-2 exposure.
(A and B) UMAP embedding is shown for all preadipocytes (n=140,867) colored by cluster (A) and sample and infection type (B) are shown. (C) A cell fraction bar plot is shown clustered by sample and infection type within each cluster. (D) Feature plots depicting expression of selected markers associated with preadipocyte cell states, cell types, and antiviral ISGs. (E) Box plots of average cytokine (top) and ISG (bottom) module scores are shown across the preadipocytes of each participant and depot in both mock and SARS-CoV-2 infection conditions. (F) Reactome pathway analysis was performed on the DEGs (padj < 0.1) between SARS-CoV-2-exposed versus mock preadipocytes by participant and cluster within SAT. Pathways that were represented and significant (padj < 0.05) in at least four of the participant-cluster subsets were included. Pathways were clustered by euclidean distance and split by the two major subtrees.

