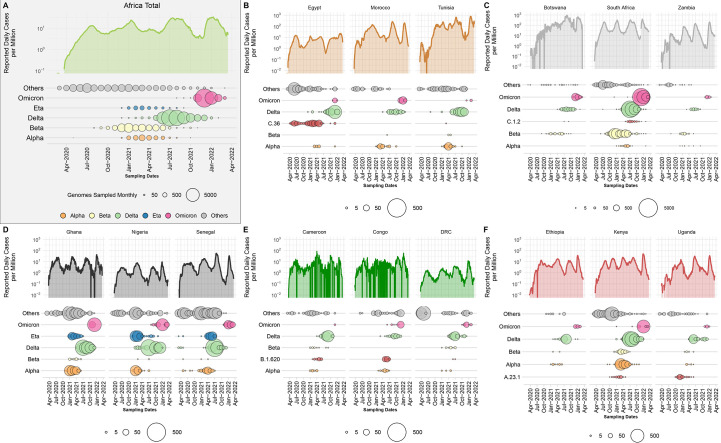
Fig. 1. Epidemiological progression of the COVID-19 pandemic on the African continent.
(A) Total reported new case counts per million inhabitants in Africa (Data Source: Our World in Data; OWID; log-transformed) along with the distribution of VOCs, the Eta VOI and other lineages through time (size of circles proportional to the number of genomes sampled per month for each category). (B to F) Breakdown of reported new cases per million (Data Source: Our World in Data; OWID; log-transformed) and monthly sampling of VOCs, regional variant or lineage of interest and other lineages for three selected countries for North, Southern, West, Central and East Africa respectively. For each region, a different variant or lineage of interest is shown, relevant to that region (C.36, C.1.2, Eta, B.1.620 and A.23.1, respectively).

