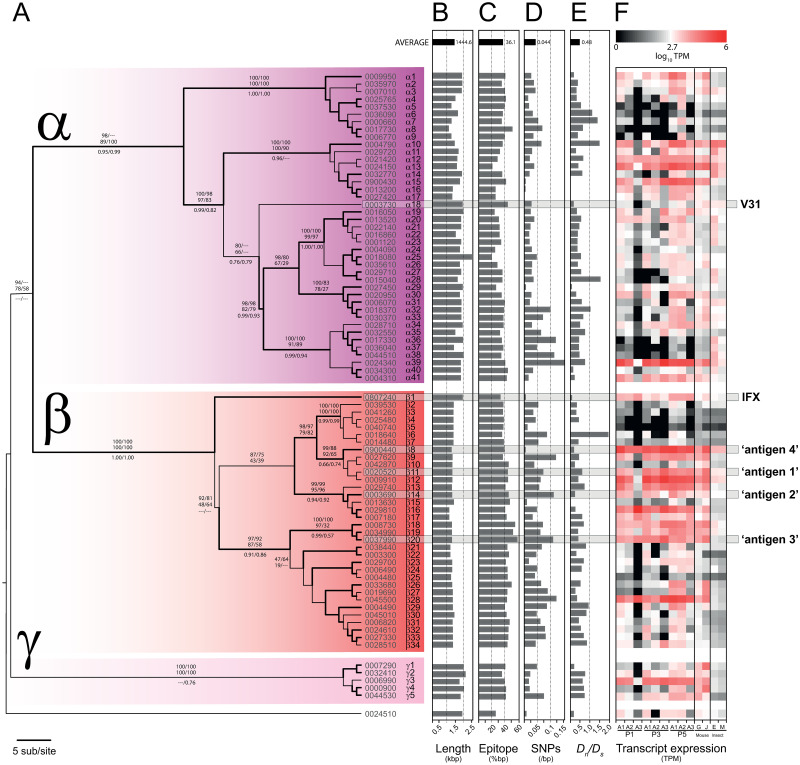
Fig 2. Vivaxin gene family phylogeny and molecular evolution.
(A) Maximum likelihood phylogeny of vivaxin genes (n = 81) in the T. vivax Y486 reference genome estimated with a GTR + Γ substitution model (α = 3.677), and divided into three principal sub-families, labelled α, β and γ. The tree is rooted with a divergent sequence (TvY486_0024510) that approximates to the mid-point. Topological robustness is measured by the approximate log-likelihood ratio (aLRT), and indicated by branch thickness. Thick branches subtend nodes with aLRT values > 0.9. Robustness measures are given for major internal nodes: maximum likelihood bootstrap values (> 75) for nucleotide/protein alignments (upper, above branches), neighbour-joining bootstrap values (> 75) for nucleotide/protein alignments (lower, above branches), and Bayesian posterior probabilities (> 0.5) for nucleotide/protein alignments (below branch). At the left of each terminal node are the existing TritrypDB gene identifier (i.e. TvY486_XXXXXXX) and new gene names; the positions of IFX and V31 antigens [23] and four expressed antigens in this study (1–4) are highlighted within horizontal grey boxes. (B) Gene length mapped to tree topology. (C) Total length of predicted human B-cell epitopes as a proportion of gene length, as inferred by Bepipred linear prediction 2.0 [50]. (D) Single nucleotide polymorphisms (SNP) across a panel of 25 T. vivax strain genomes (as described previously in [48]), as a proportion of gene length. (E) Ratio of non-synonymous to synonymous substitutions (Dn/Ds) inferred from published SNP data [48]. (F) Heat maps showing vivaxin gene expression profiles from published T. vivax transcriptomes [25,48]. The first nine columns show relative transcript abundance during an experimental infection in goats. Three peaks in parasitaemia are shown (first, third and fifth respectively; see [48]), with three replicates for each (A1-A3). Columns 10 and 11 show relative transcript abundance in bloodstream-stage infections in mice using different T. vivax strains, LIEM-176 [49] and IL1392 [25], respectively. Columns 12 and 13 show transcript abundance in batch transcriptomes of in vitro cultured T. vivax insect-stages, i.e. epimastigotes (E) and metacyclic-forms (M) respectively [25].

