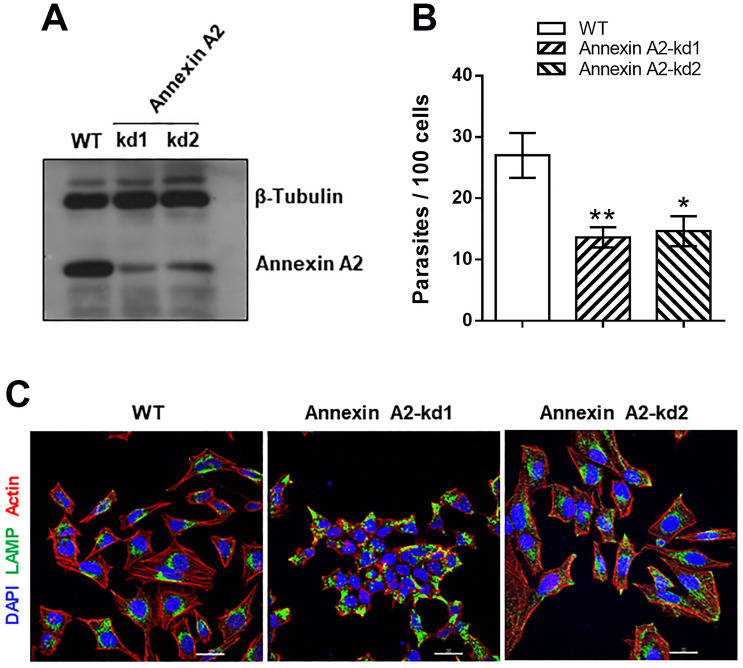
Fig 4. Increased resistance of annexin A2-depleted cells to G strain MT invasion.
(A) HeLa cells were submitted to lentiviral transduction for annexin A2 knockdown (kd) and analyzed by western blotting. Note the depletion of annexin A2 in two independent cell lines. (B) HeLa cells depleted in annexin A2 and WT cells were incubated for 1 h with G strain MT. The amounts of intracellular parasites are shown as means ± SD of three independent assays performed in duplicate. MT invasion was significantly diminished in cells deficient in annexin A2 (*P<0.01, **P<0.005). (C) Non infected annexin A2-deficient and WT cells were analyzed by immunofluorescence, to visualize actin (red), lysosome (green) and nucleus (blue). Scale bar = 30 μm. Note the altered morphology of annexin-kd1 cells, as compared to WT cells, and the distinct lysosome distribution in annexin-kd2 cells.

