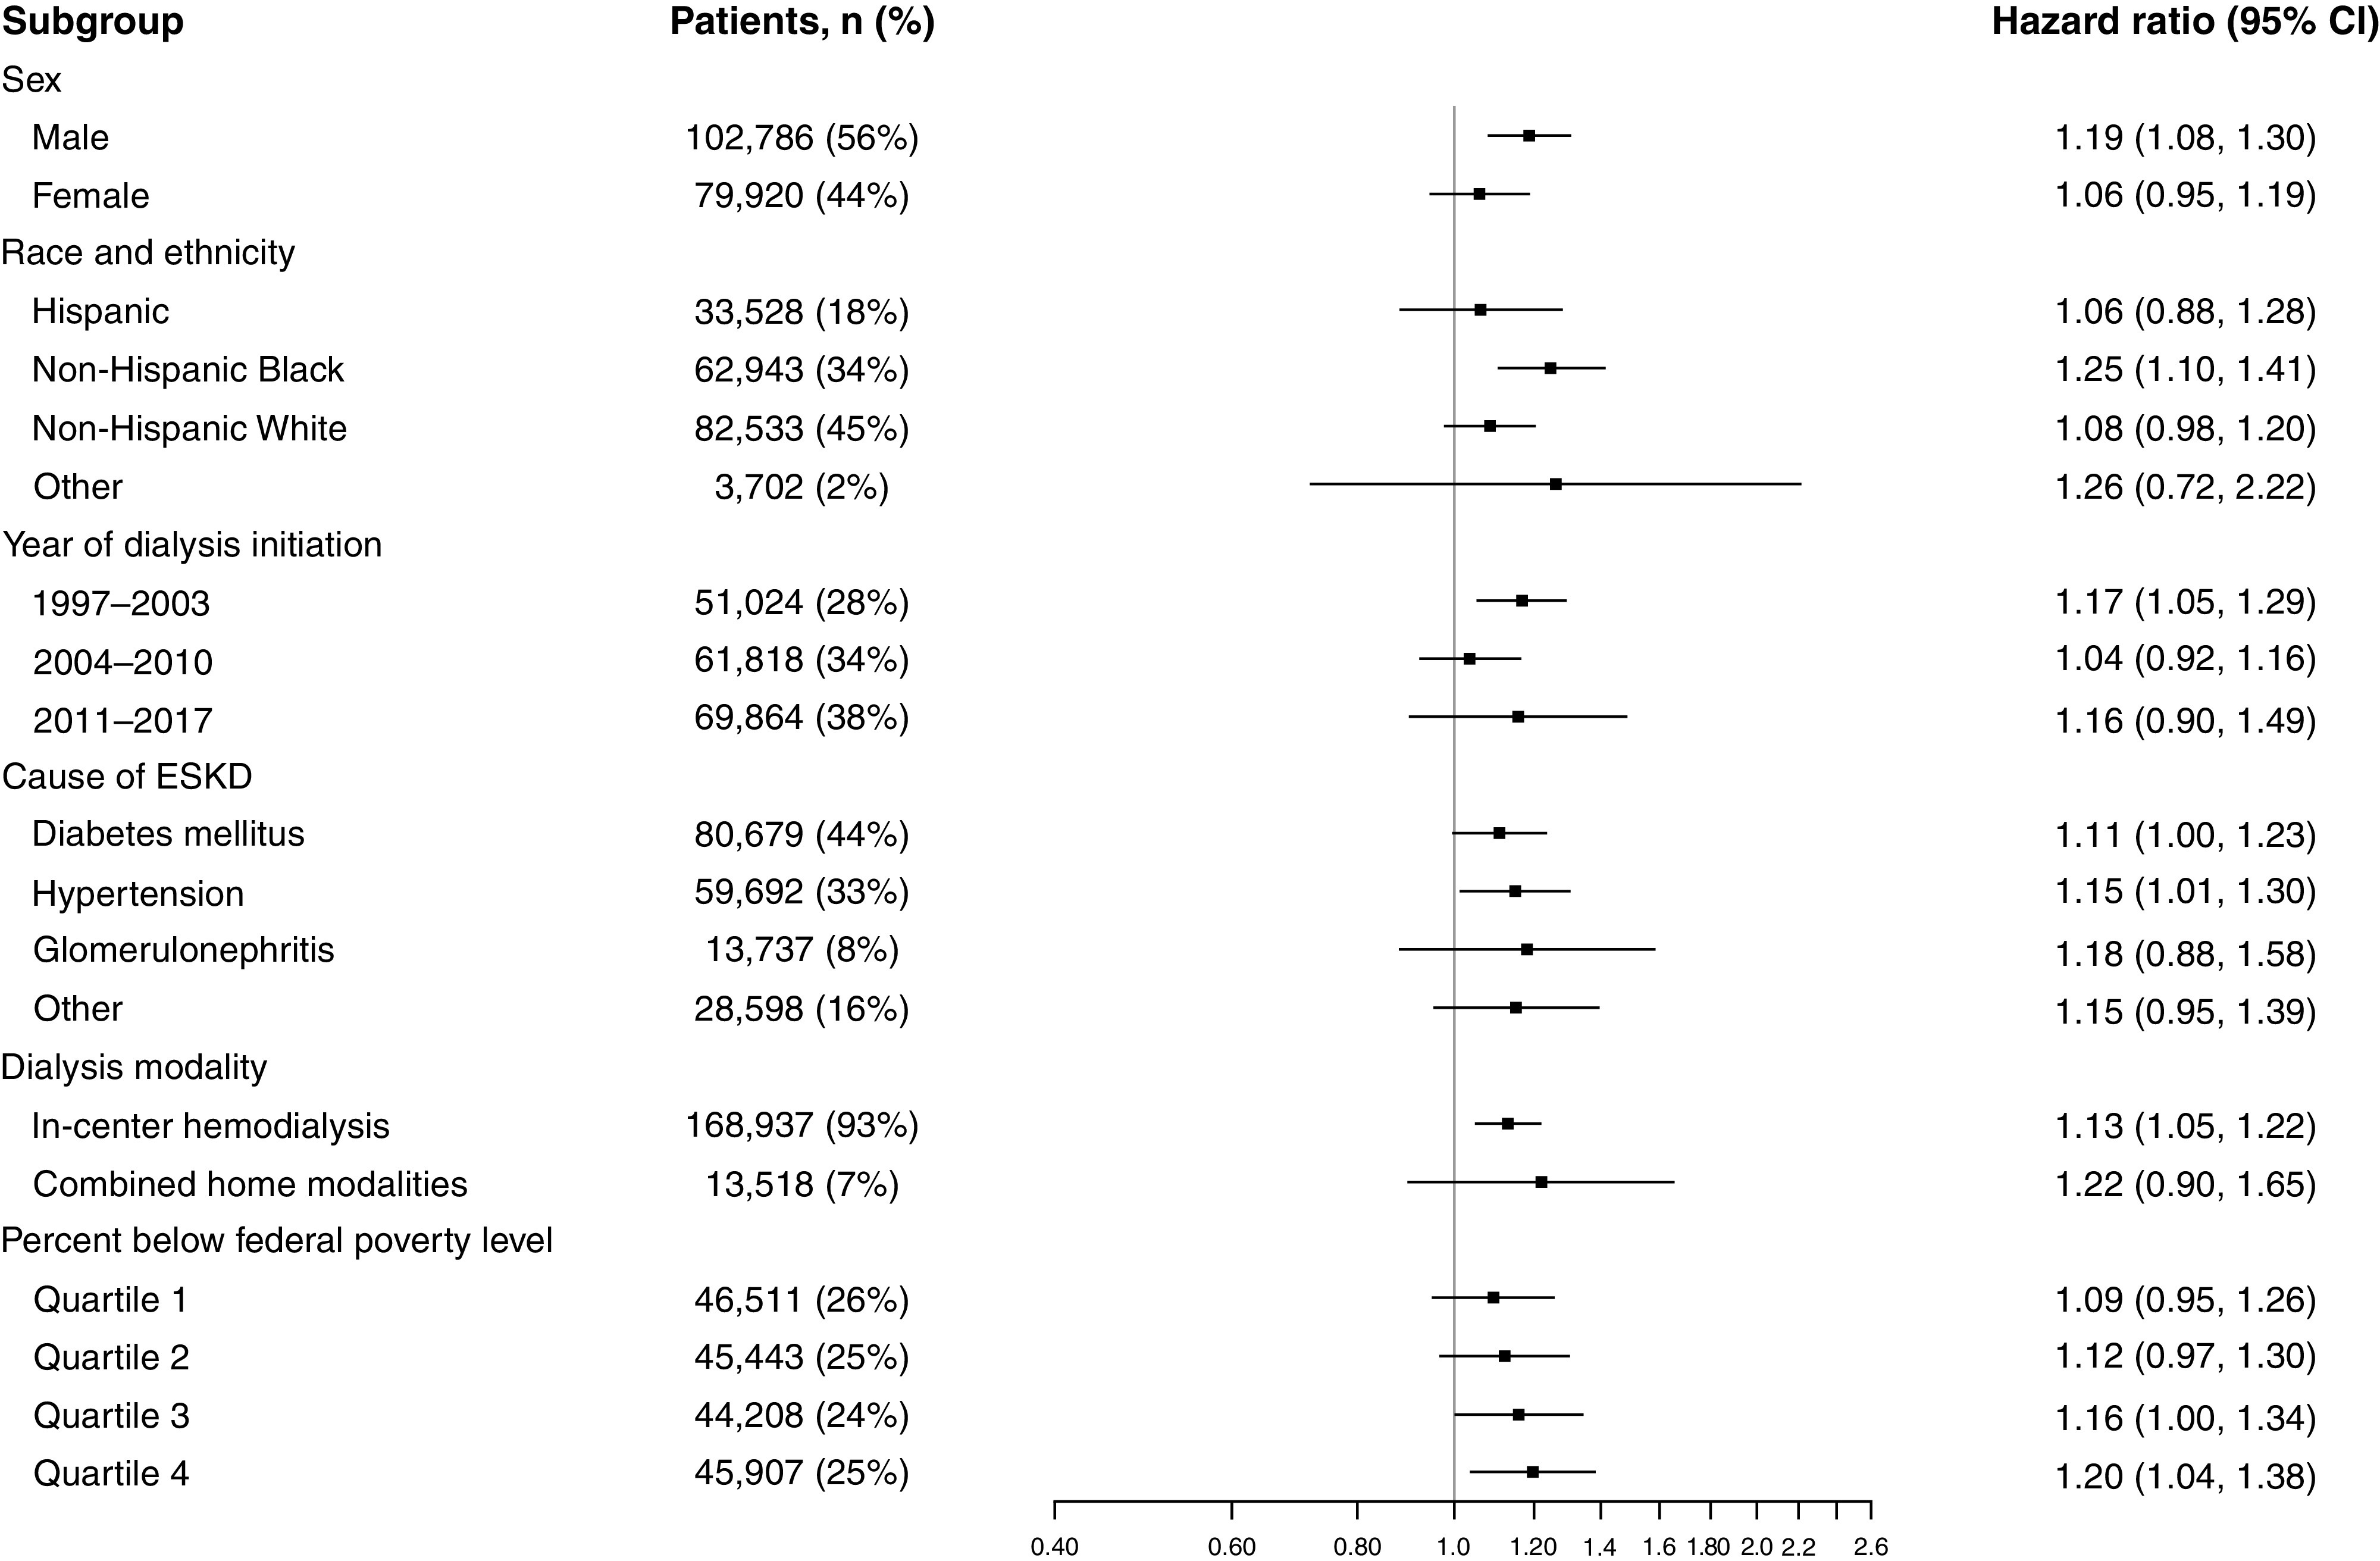
Figure 2.

Forest plot demonstrating the associations of hurricane exposure and mortality in patients who are dialysis dependent in the United States from 1997 to 2017, stratified by subgroup. Patients with an unknown dialysis modality were excluded from this figure due to a lack of hurricane-related deaths.
