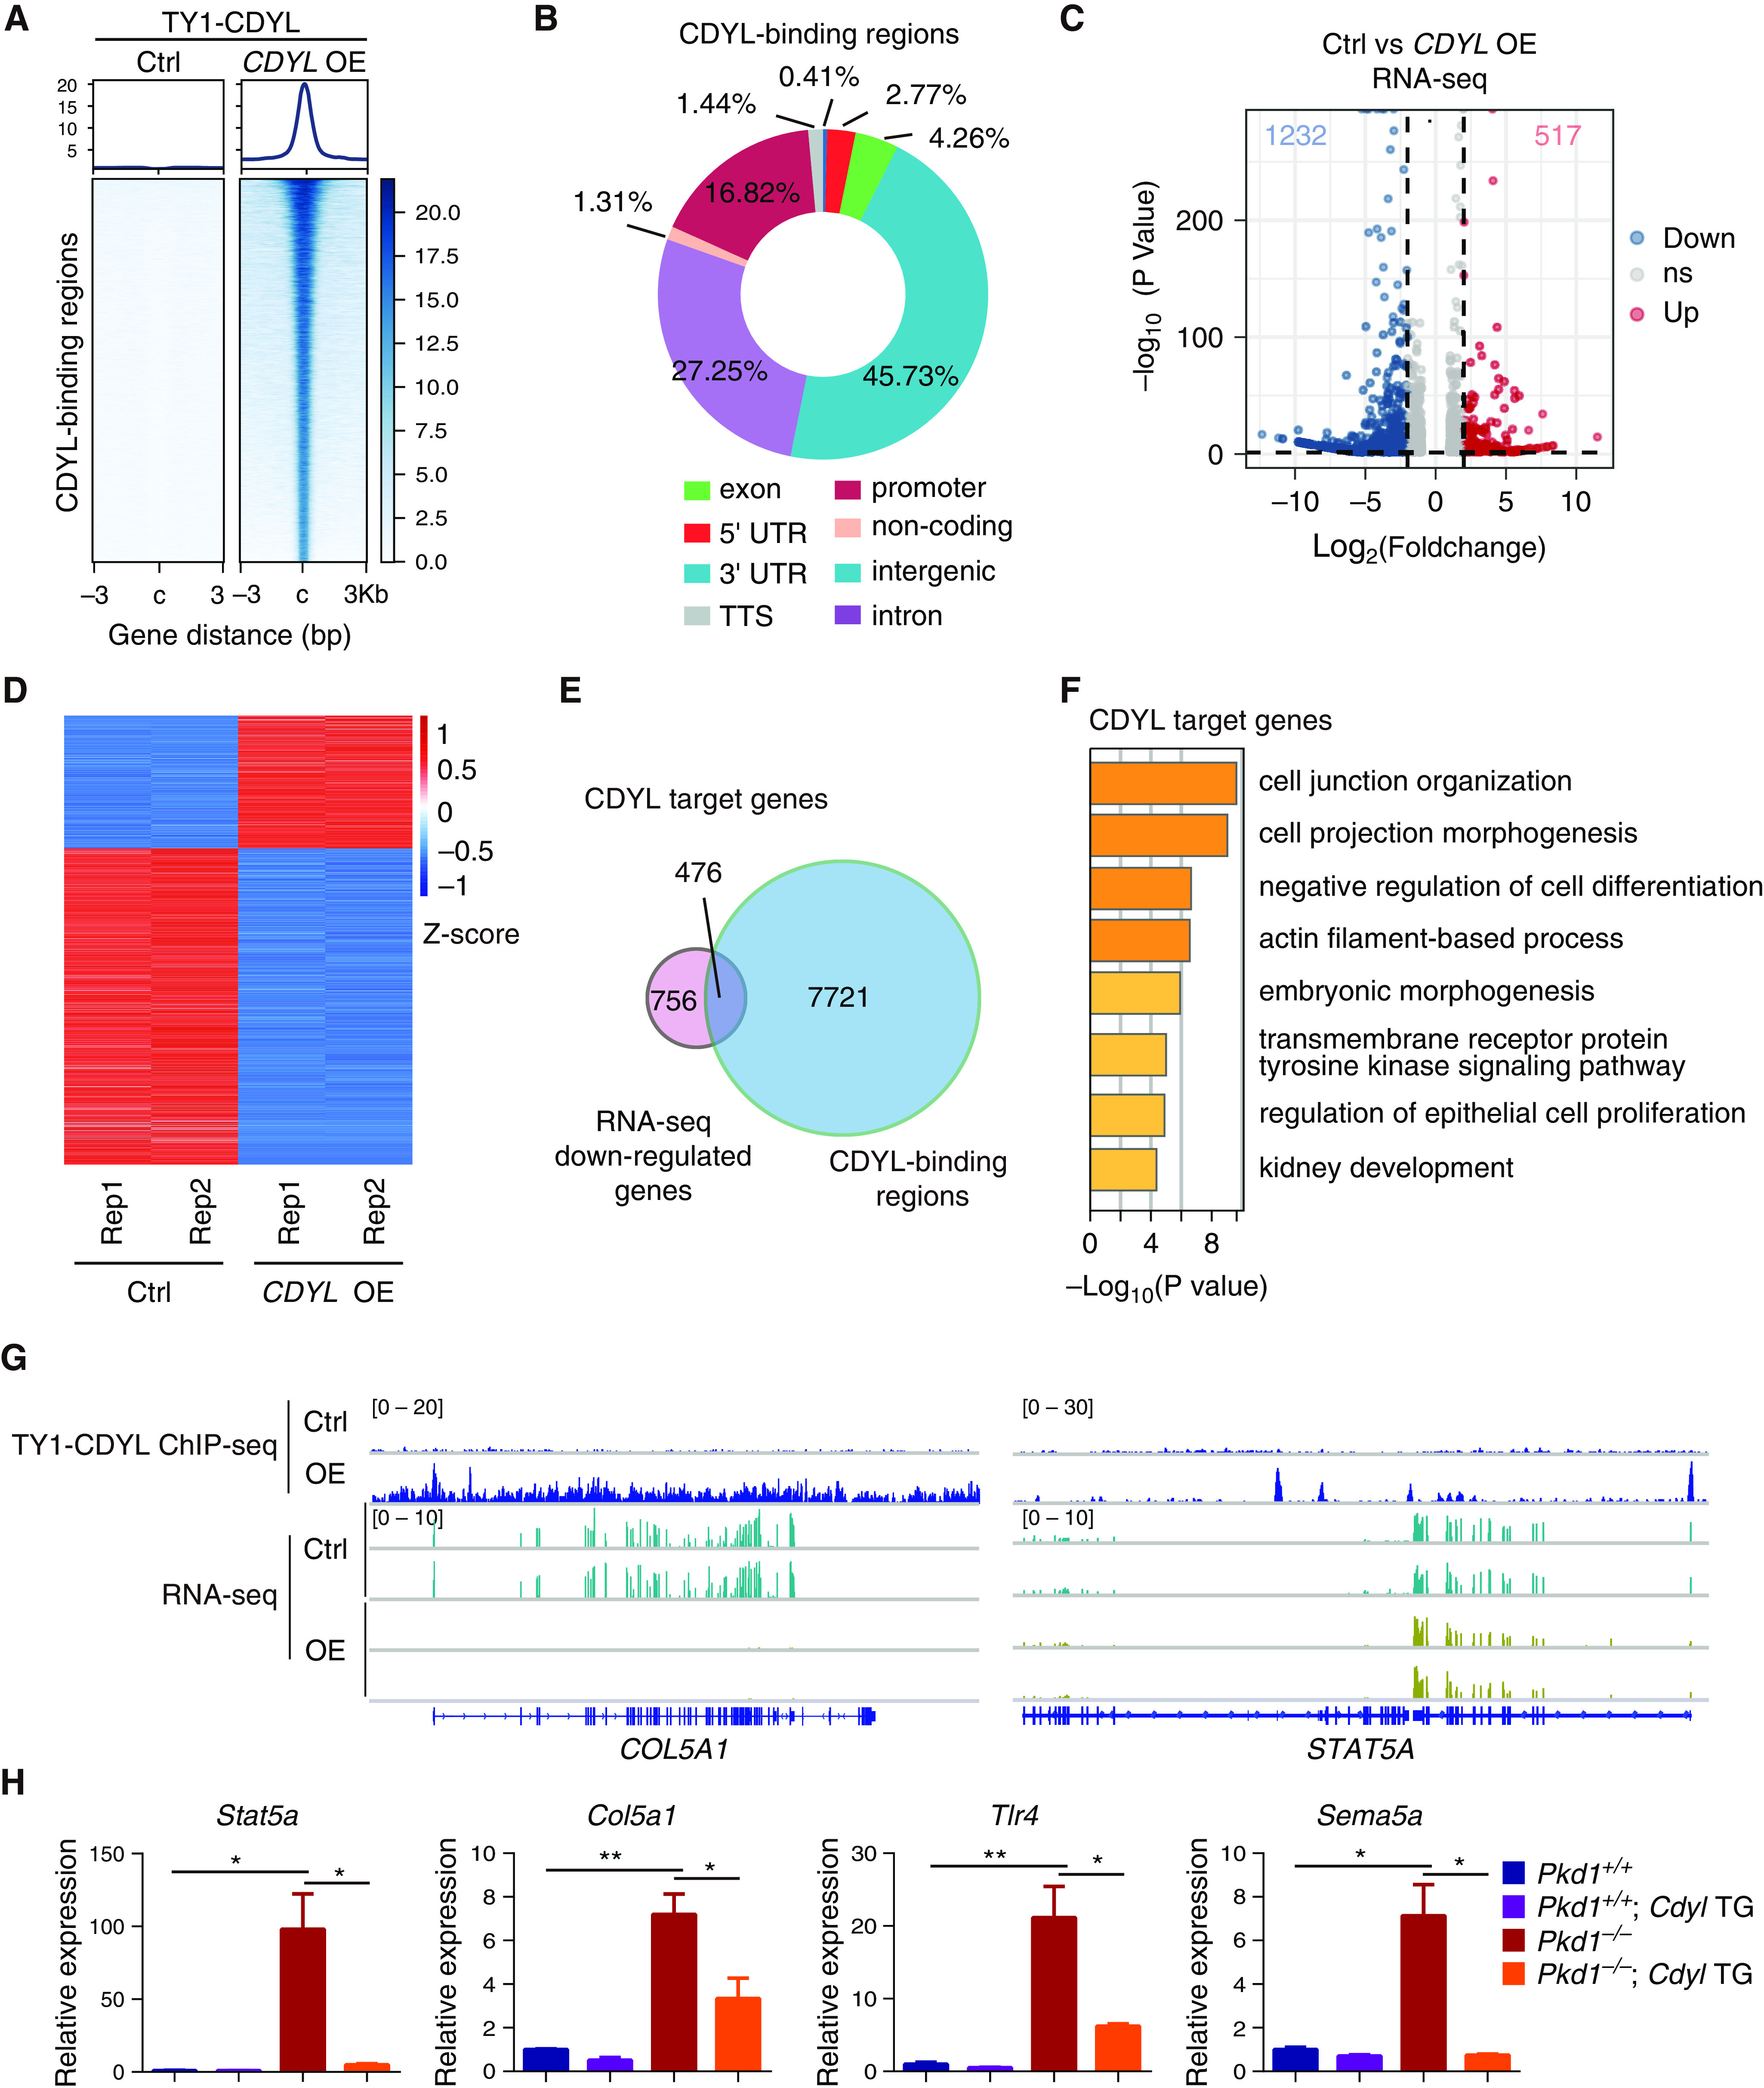
Figure 3.

Integrated cistromic and transcriptomic analysis reveals cyst-promoting genes regulated by CDYL in ADPKD cells. (A) Heatmaps showing the occupancy of TY1-CDYL in control and CDYL overexpression (OE) WT 9-12 cells centered on peak summits ±3 kb. The ChIP-seq signal heatmap using a 6-kb window was centered on peak regions. (B) Genomic distribution of CDYL-binding regions in CDYL OE WT 9-12 cells (compared with control cells). (C) Volcano plot showing differentially expressed genes (control versus CDYL OE). (D) Heatmap of differentially expressed genes in control and CDYL OE WT 9-12 cells. (E) Venn diagram showing overlap of CDYL-binding regions and downregulated genes upon CDYL overexpression in CDYL OE WT 9-12 cells. (F) Gene ontology enrichment analysis of CDYL target genes. (G) Gene tracks showing TY1-CDYL ChIP-seq and RNA-seq profiles at the indicated gene loci. (H) RT-qPCR analysis of mRNA level of Stat5a, Col5a1, Tlr4, and Sema5a in each of the indicated groups. Data are represented as mean±SEM and were analyzed by two-sided unpaired t test. *P<0.05, **P<0.01.
