Figure 5.

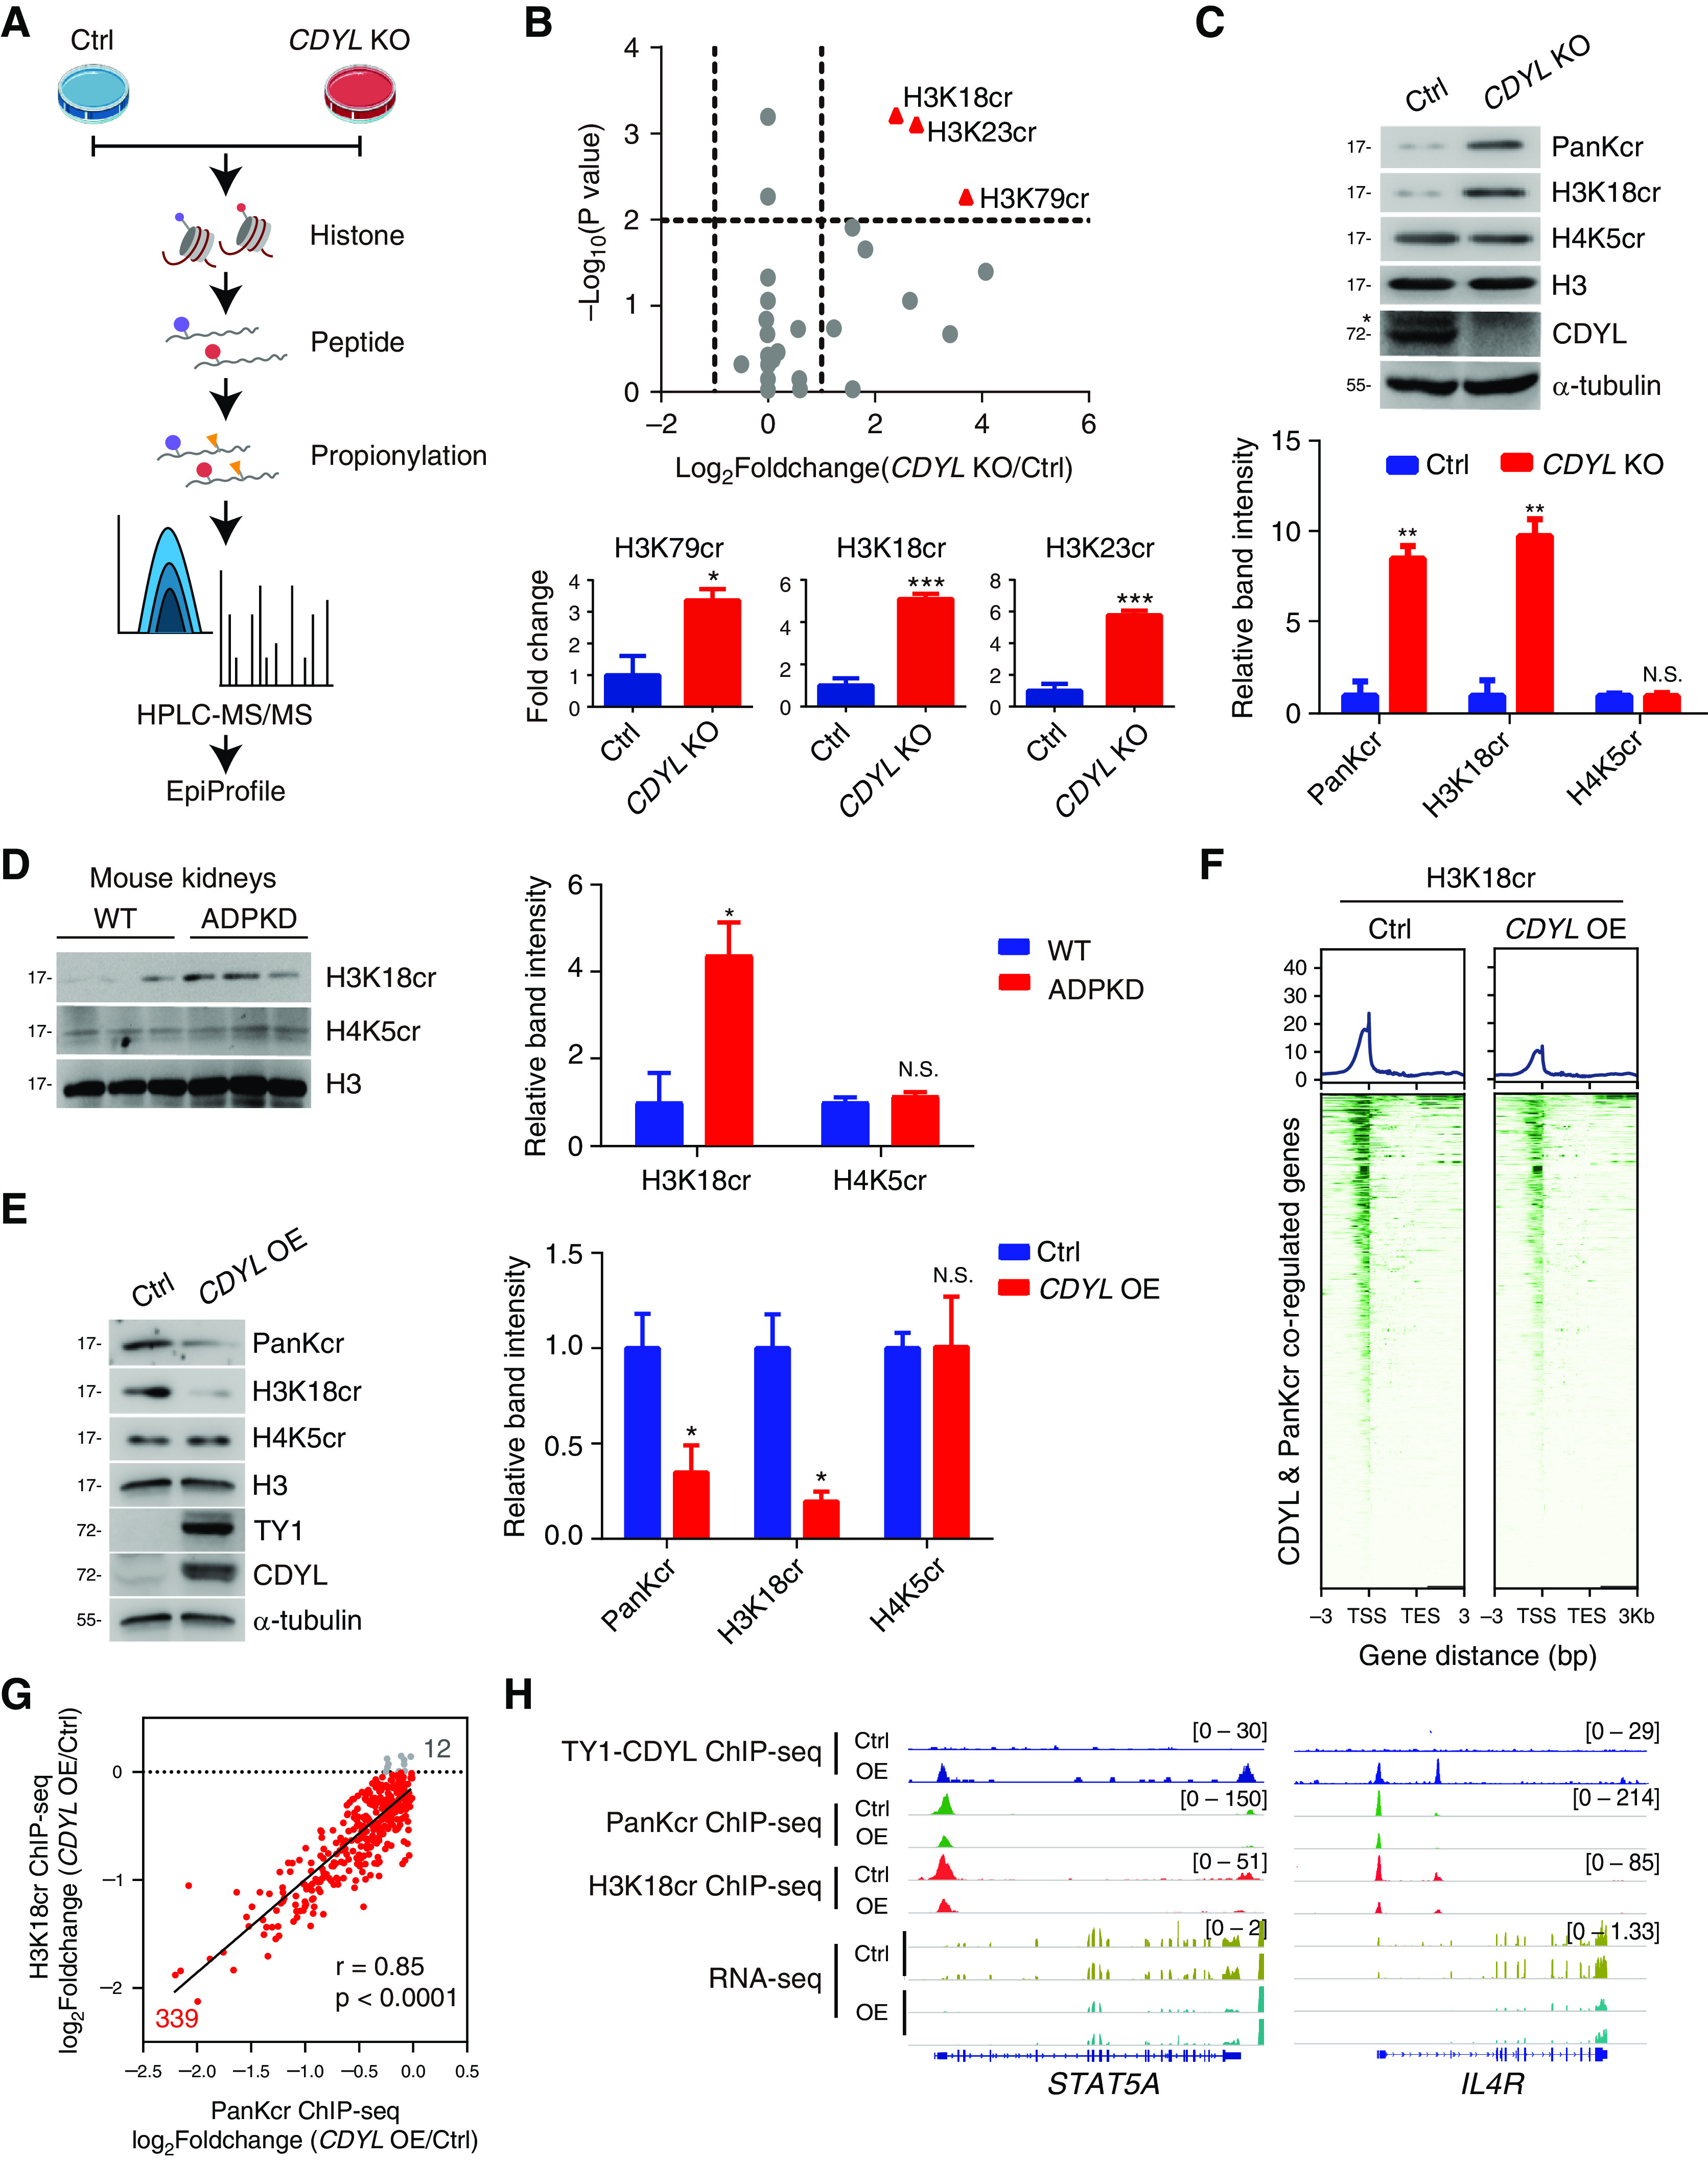
H3K18 is the major crotonylation site controlled by CDYL in ADPKD cells. (A) Experimental workflow of the HPLC-MS/MS assays to quantify histone Kcr in control and CDYL KO WT 9-12 cells. (B) Volcano plot showing histone crotonylation changes versus P values in CDYL OE WT 9-12 cells versus control cells comparisons (top). Bar graphs show relative histone crotonylation in control cells and CDYL OE WT 9-12 cells (bottom). *P<0.05, ***P<0.001. (C) Western blot analysis of histone Kcr in control and CDYL KO WT 9-12 cells (top). *Represents nonspecific band. Averaged histone Kcr levels are shown after normalization to the value for H3 (bottom). Two-tailed unpaired t test. **P<0.01, N.S., not significant. (D) Western blot analysis of histone Kcr in ADPKD mouse kidneys (left). Averaged histone Kcr levels are shown after normalization to the value for H3 (right). Two-tailed unpaired t test. *P<0.05, N.S.: not significant. (E) Western blot analysis of histone Kcr in CDYL OE WT 9-12 cells (left). Quantification of histone Kcr (right). Two-tailed unpaired t test. *P<0.05, N.S., not significant. Two-tailed unpaired t test. (F) Heatmaps showing the occupancy of H3K18cr binding on TY1-CDYL and PanKcr coregulated genes in control cells and CDYL OE WT 9-12 cells. (G) Pearson’s correlation coefficient of H3K18cr ChIP-seq signals and PanKcr ChIP-seq signals. (H) Gene tracks showing representative genes in control and CDYL OE WT 9-12 cells.
