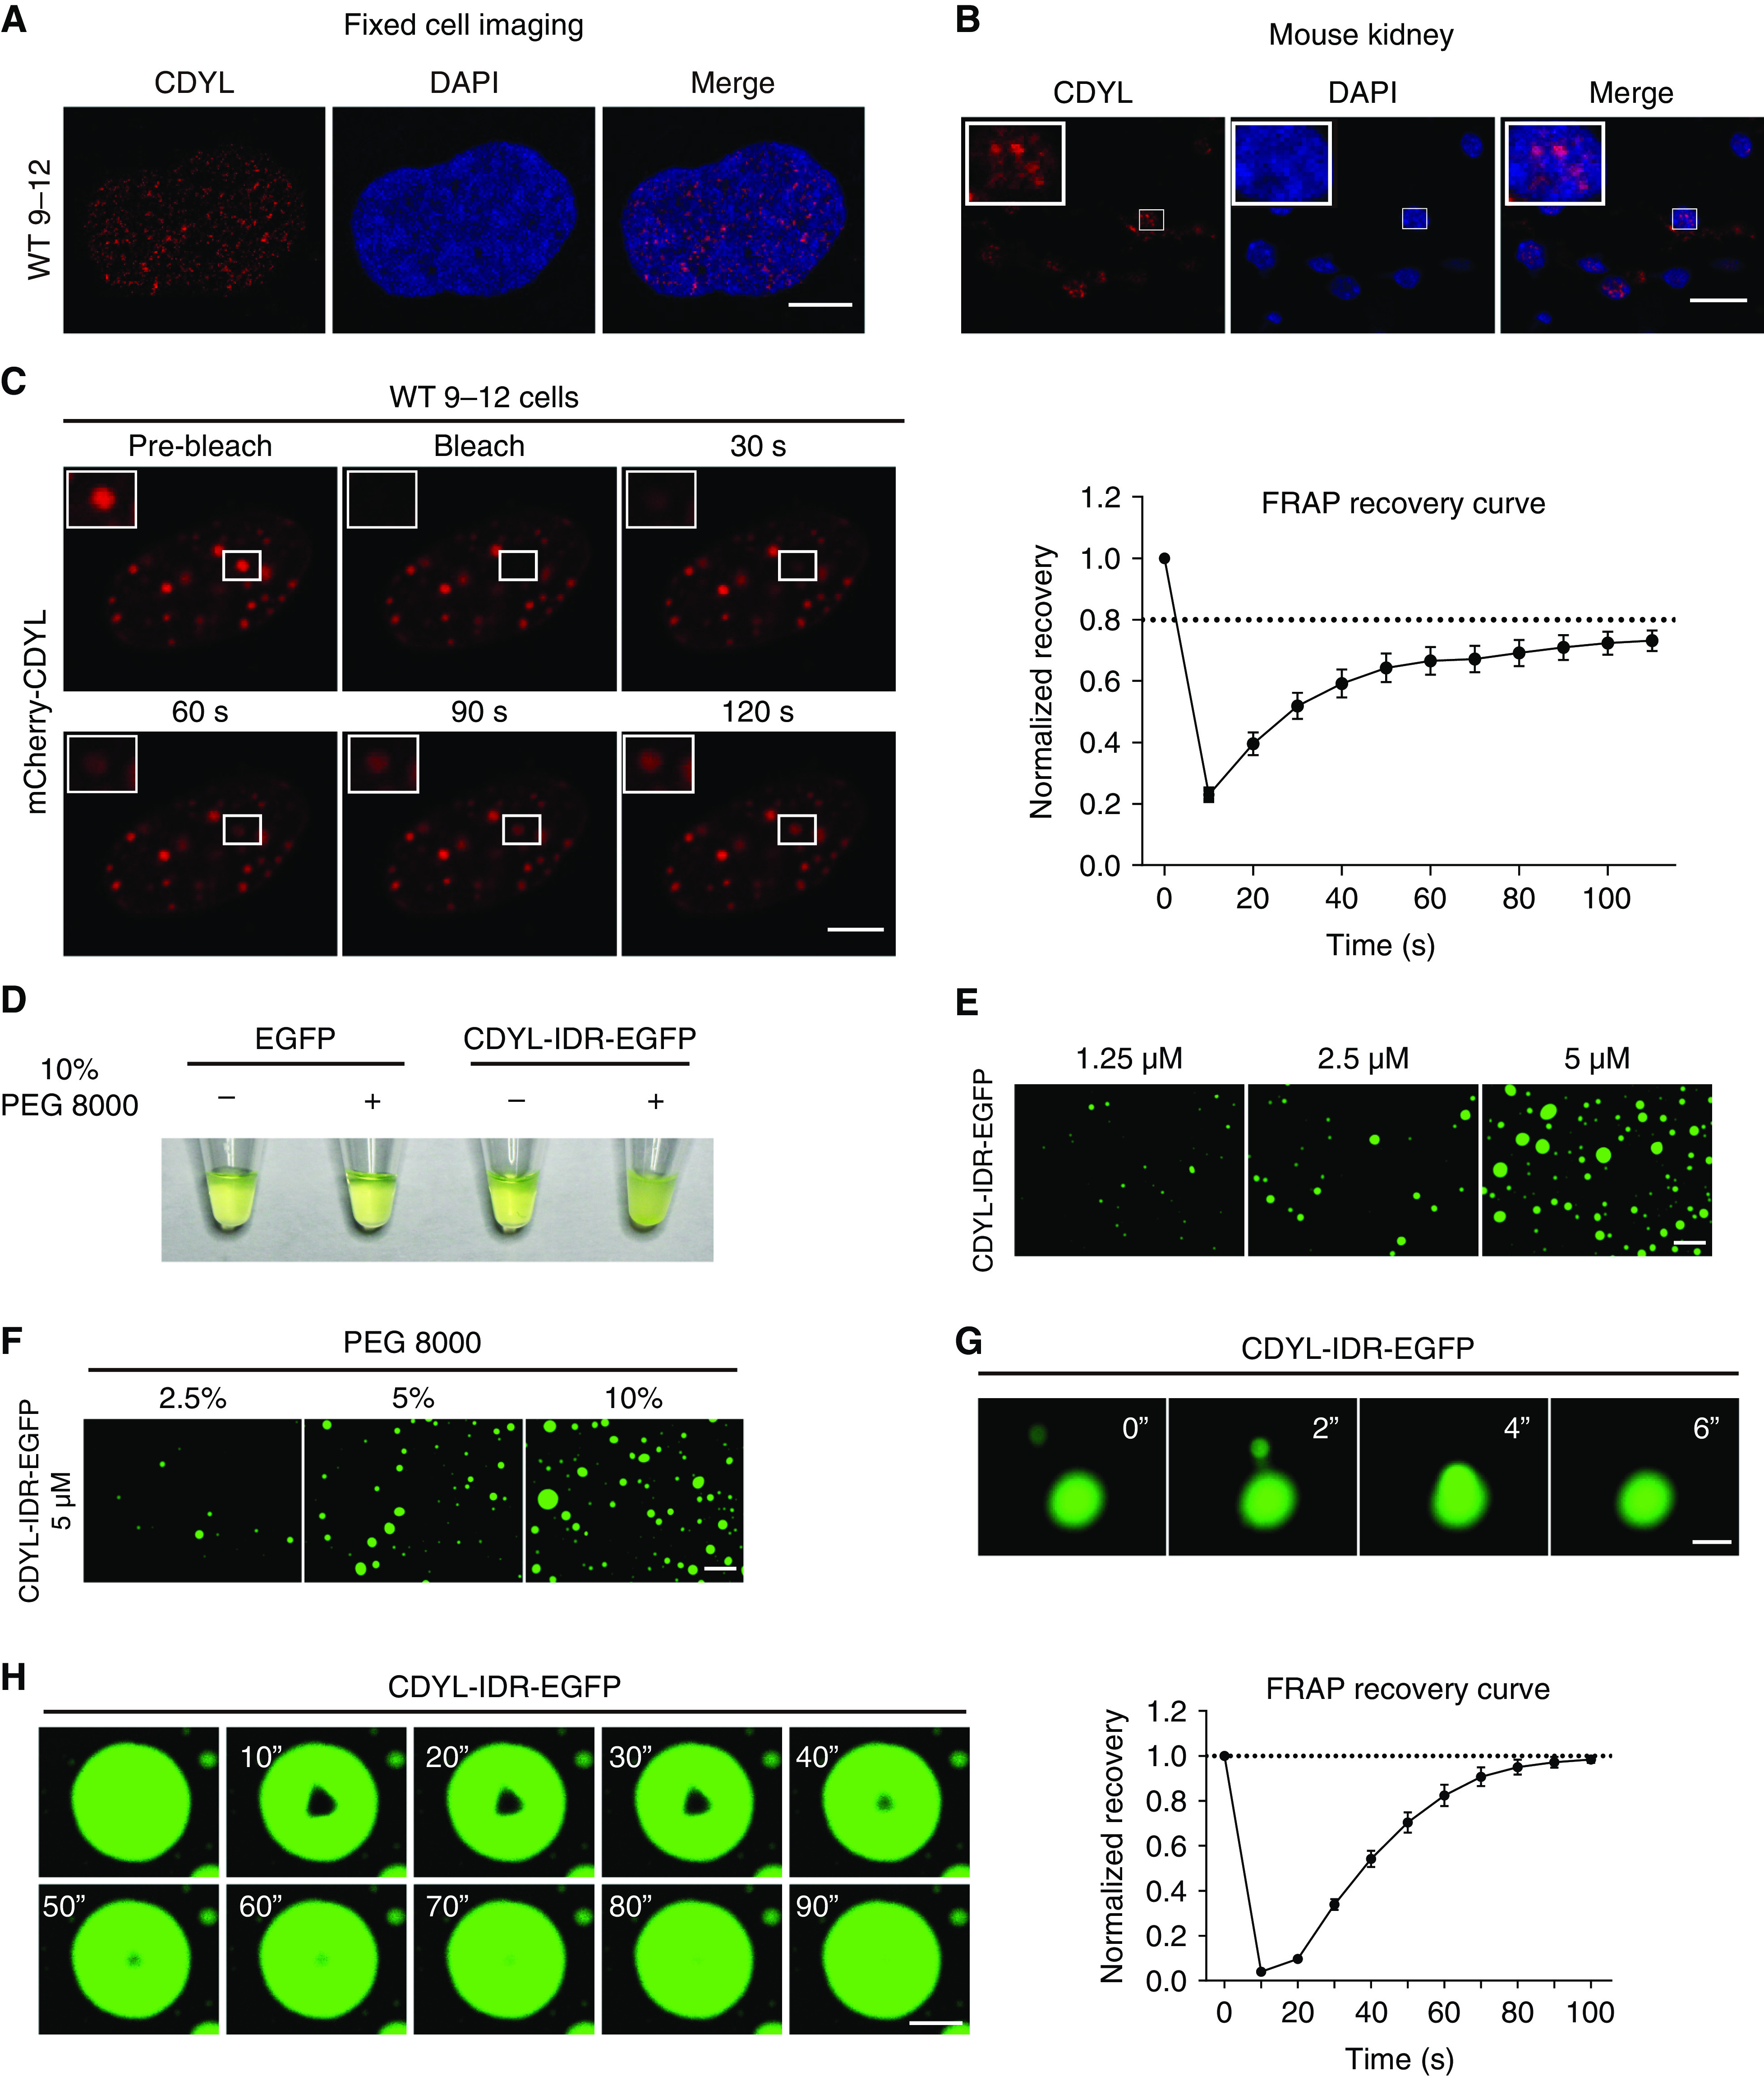
Figure 6.

CDYL forms condensates through phase separation in vitro and in vivo. (A) Immunofluorescence imaging of CDYL in WT 9-12 cells. Scale bar, 5 μm. (B) Immunofluorescence imaging of CDYL in normal mouse kidney tissue. Scale bar, 10 μm. (C) FRAP assay of mCherry-CDYL droplets at the indicated time points. Scale bar, 5 μm. Normalized FRAP intensity curve of mCherry-CDYL droplets. Data represent mean±SEM (right, n=7). (D) Visualization of turbidity associated with protein droplet formation. Tubes containing EGFP and CDYL-IDR-EGFP in the absence (−) or presence (+) of PEG 8000 are shown. (E) Representative images of CDYL-IDR-EGFP droplet formation at the indicated concentrations. Scale bar, 50 μm. (F) Representative images of CDYL-IDR-EGFP droplet formation at the indicated PEG 8000 concentrations. Scale bar, 50 μm. (G) Fusion of CDYL-IDR-EGFP droplets over 6 seconds. Scale bar, 5 μm. (H) FRAP assay of CDYL-IDR-EGFP condensates. Scale bar, 5 μm. FRAP recovery curve of CDYL-IDR-EGFP condensates. Data represent mean±SEM (right, n=4).
