Figure 7.

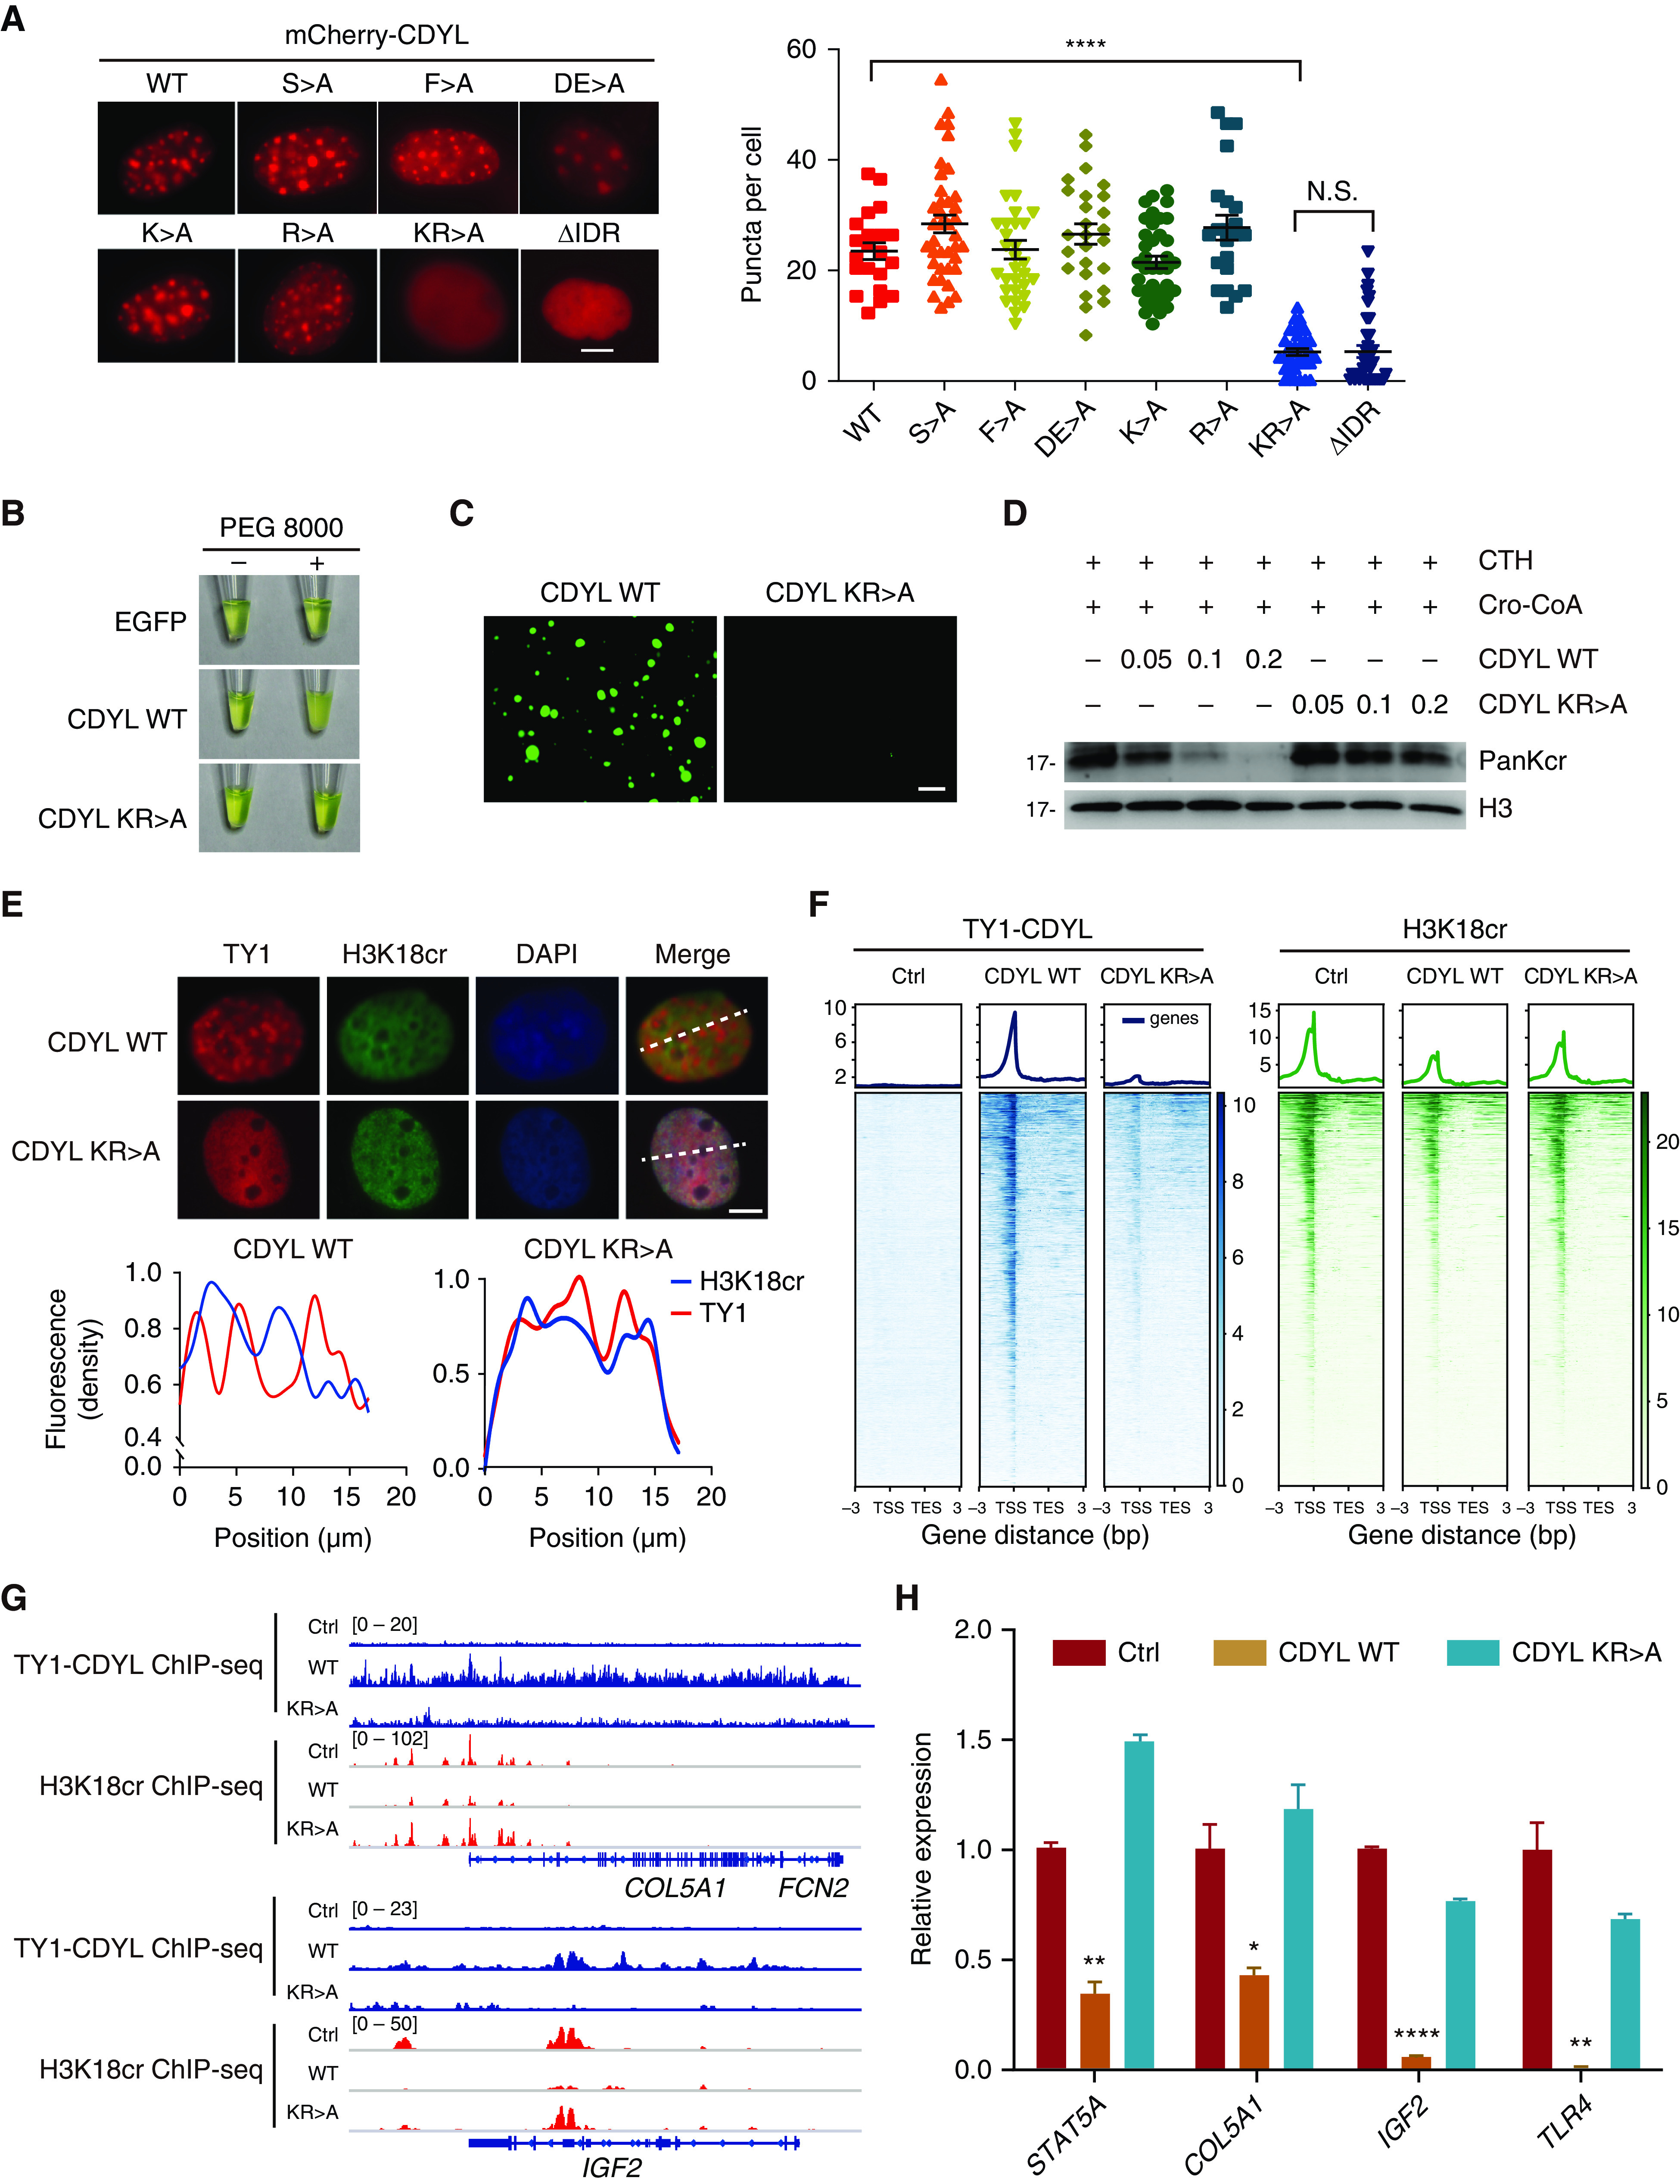
Phase separation increases the catalytic activity of CDYL on histone Kcr. (A) Immunofluorescence imaging of CDYL WT or various mutants in WT 9-12 cells (left). Quantification of CDYL WT or mutants’ puncta (right). Two-tailed unpaired t test. ****P<0.0001, N.S., not significant. Scale bar, 5 μm. (B) Visualization of turbidity associated with protein droplet formation. Tubes containing EGFP, CDYL WT, and CDYL KR>A in the absence (−) or presence (+) of PEG 8000 are shown. (C) Representative images of CDYL WT condensates and CDYL KR>A condensates. Scale bar, 50 μm. (D) In vitro Kcr assays with 0.05, 0.1, or 0.2 μg CDYL WT or KR>A and 50 μM crotonyl-CoA in the presence of 5 μg CTH. Reactions were analyzed by Western blot. (E) Immunofluorescence imaging of TY1-CDYL and H3K18cr in CDYL WT or KR>A WT 9-12 cells (top). Scale bar, 5 μm. Quantitative analysis of TY1-CDYL and H3K18cr immunofluorescence density on the dashed lines (bottom). (F) Heatmaps showing the occupancy of TY1-CDYL (left) and H3K18cr (right) binding on TY1-CDYL target genes in the indicated groups. (G) Gene tracks showing representative genes in the indicated groups. (H) RT-qPCR analysis of relative mRNA expression of STAT5A, COL5A1, IGF2, and TLR4 in each of the indicated groups. Data are represented as mean±SEM and were analyzed by two-tailed unpaired t test, *P<0.05, **P<0.01, and ****P<0.0001.
