Figure 2.

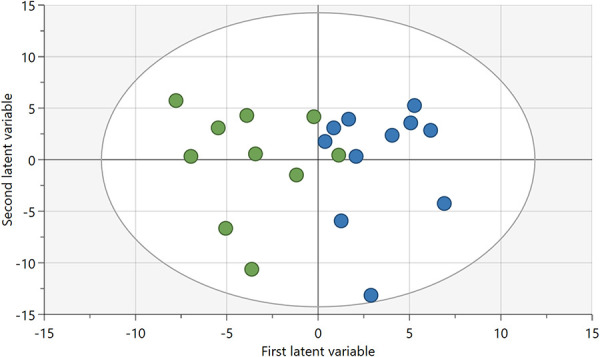
Score plot of OPLS-DA regression model of lipoproteins and cytokines among patients with NeuP (green) and healthy controls (blue). NeuP, neuropathic pain; OPLS-DA, orthogonal partial least squares discriminant analysis.

Score plot of OPLS-DA regression model of lipoproteins and cytokines among patients with NeuP (green) and healthy controls (blue). NeuP, neuropathic pain; OPLS-DA, orthogonal partial least squares discriminant analysis.