. 2022 Oct 3;11:e79128. doi: 10.7554/eLife.79128

Figure 1. S6K1 protects cells from DNA damaging agents.

(a) Long (S6K1) and short (Iso-2) S6K1 isoform structure and domain organization with addition of Halo-tag (light blue ovals). Isoform Iso-2 lacks 6 out of 12 conserved regions of the kinase domain, a mTOR phosphorylation site at threonine 389 (T389), as well as the C terminal autoinhibitory domain (CTD). NLS (nuclear localization sequence), NTD (N terminal domain). (b) Western blot showing the expression of S6K1 in MEF wild type (WT), S6K-/- cells and S6K-/- cells transduced with retroviruses encoding either empty vector pBABE (pB(-)), S6K1 or Iso-2. (c,f,i) Trypan blue exclusion assay of MEF WT, S6K-/- and S6K-/- cells described in (b) treated with doxorubicin 8 μg/ml (DOX) for 24 hr (c) or 24 hr after either γ irradiation 5 Gy (f) or UVC 8 J/m2/s (i). Data represents means ± SD of six replicates. (d,e,g,h,j) Clonogenic survival assay of MEF WT, S6K-/- cells (d,g,h,j), and S6K-/- cells transduced with retroviruses encoding either empty vector pBABE (pB(-)), S6K1 or Iso-2 (e,g,h,j) treated with various concentrations of Dox (d,e), γ irradiation 1–5 Gy (g), UVC 6.5 J/m2/s (h) or various concentrations of neocarzinostatin (NCS) (j). Colonies were fixed and quantified after 14 days. Data represents means ± SD of at least three biological replicates. (k) Clonogenic survival assay of S6K-/- cells expressing either empty vector pBABE (pB(-))or S6K1. Cells were treated with various concentrations of doxorubicin (DOX) with and without 50 nM rapamycin (R). Data represents means ± SD of three biological triplicates. (l,m) Western blot analysis of MEF WT and S6K-/- cells (l) or cells described in (b) (m) 24 hours after irradiation with UVC 6.5 J/m2/s. Cleaved caspase 3 and γ−H2AX signals were quantified relative to GAPDH signal. * p<0.05, ** p<0.01, *** p<0.001. p values were calculated using Student’s t-test (two-tailed). Data represents means ± SD of three biological triplicates.

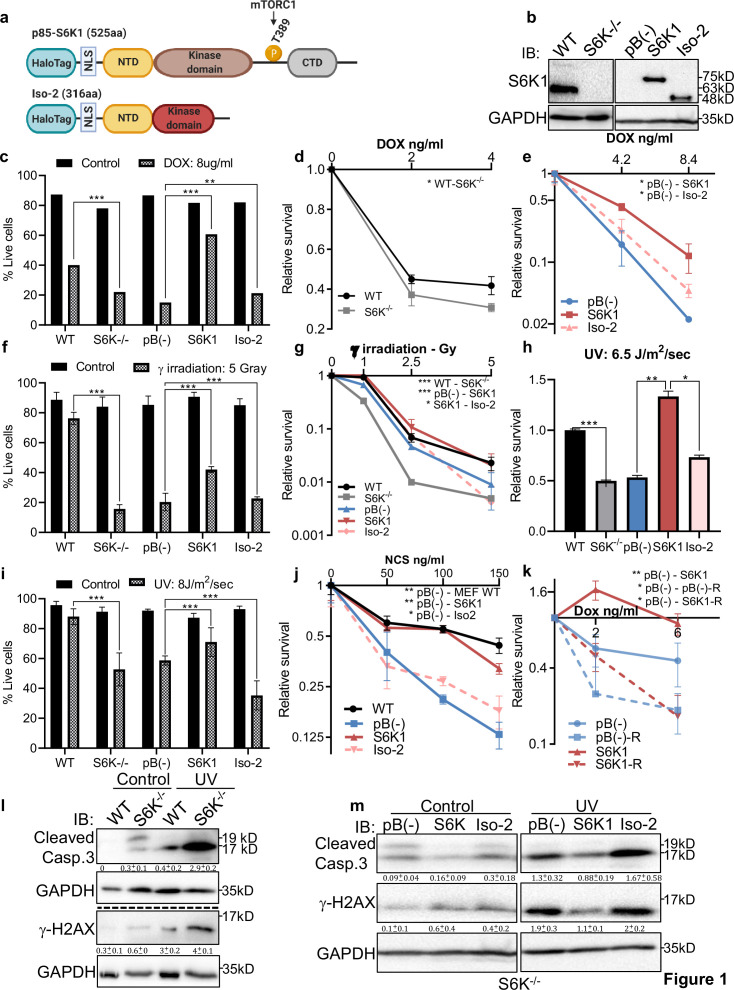
Figure 1—source data 1. Western blots of Figure 1.

Figure 1.

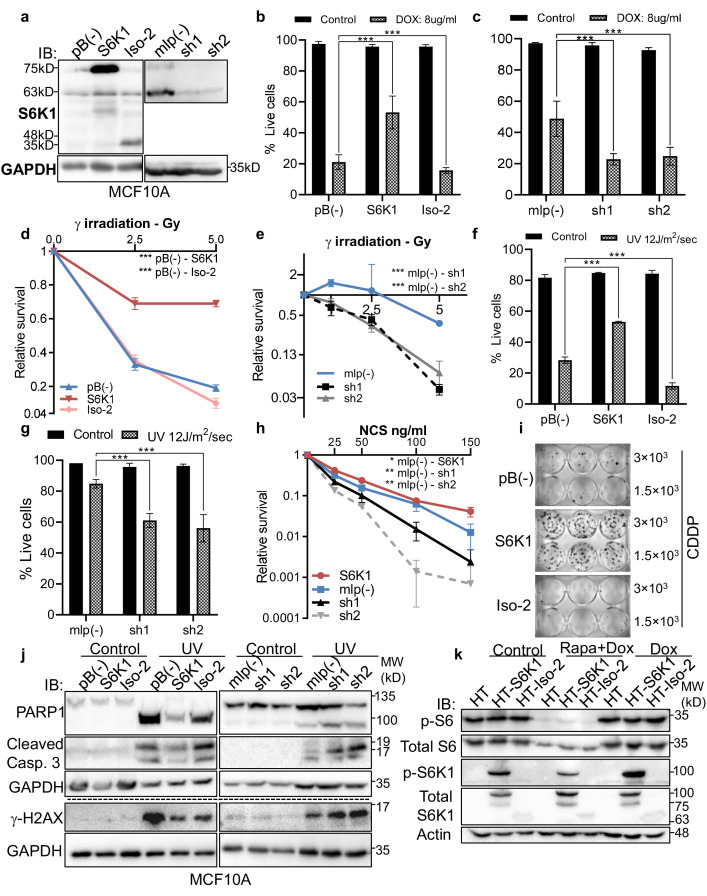
Figure 1—figure supplement 1. S6K1 protects MCF-10A cells from DNA damaging agents.

Figure 1—figure supplement 1.

(a) Western blot showing the expression of S6K1 in MCF-10A cells transduced with retroviruses encoding either empty vector pBABE (pB(-)), S6K1, Iso-2 or empty vector mlp(-), S6K1-specific shRNAs (sh1, sh2). (b,c,f,g) Trypan blue exclusion assay of MCF-10A cells transduced with retroviruses encoding either empty vector pBABE (pB(-)), S6K1 or Iso-2 (b, f) or mlp(-), S6K1-specific shRNAs (sh1,sh2) (c, g) treated with either 8 mg/µl doxorubicin (DOX) for 24 hr (b,c) or 24 hr after exposure to UVC 8 J/m2/s (f,g). Data represents means ± SD of six replicates. (d,e,h) Clonogenic survival assay of MCF-10A cells over-expressing either S6K1 or Iso-2 (d,h) or MCF-10A cells expressing S6K1-specific shRNAs (sh1,sh2) (e,h). Cells were exposed to γ irradiation 1–5 Gy (d,e) or various concentrations of neocarzinostatin (NCS) (h). Colonies were fixed and quantified after 14 days. Data represents means ± SD of four replicates. (i) Clonogenic survival assay of MCF-10A cells transduced with the either empty vector pBABE (pB(-)), S6K1 or Iso-2 and treated with 10 mM cisplatin (CDDP) for 16 hr. Cells were seeded at either 3000 or 1500 cells/well. After 14 days, colonies were fixed and stained. Experiment was performed in triplicate. (j) Western blot analysis of MCF-10A cells transduced with retroviruses encoding either empty vector pBABE (pB(-), S6K1 or Iso-2 or mlp(-)), S6K1-specific shRNAs (sh1, sh2) 24 hr after irradiation with UVC 12 J/m2/s. (k) Western blot of U2OS cells transfected with either control Halo-tag vector (HT), S6K1 or Iso-2. Forty-eight hr after transfection the cells were either untreated (Control) or treated with either doxorubicin (DOX) (0.5 µg/ml) or doxorubicin and Rapamycin (100 nM) (Rapa +DOX). 3.5 hr after treatment cells were harvested and subjected to western blot. * p<0.05, ** p<0.01, *** p<0.001. p values were calculated using Student’s t-test (two-tailed).
Figure 1—figure supplement 1—source data 1. Western blots of Figure 1—figure supplement 1.
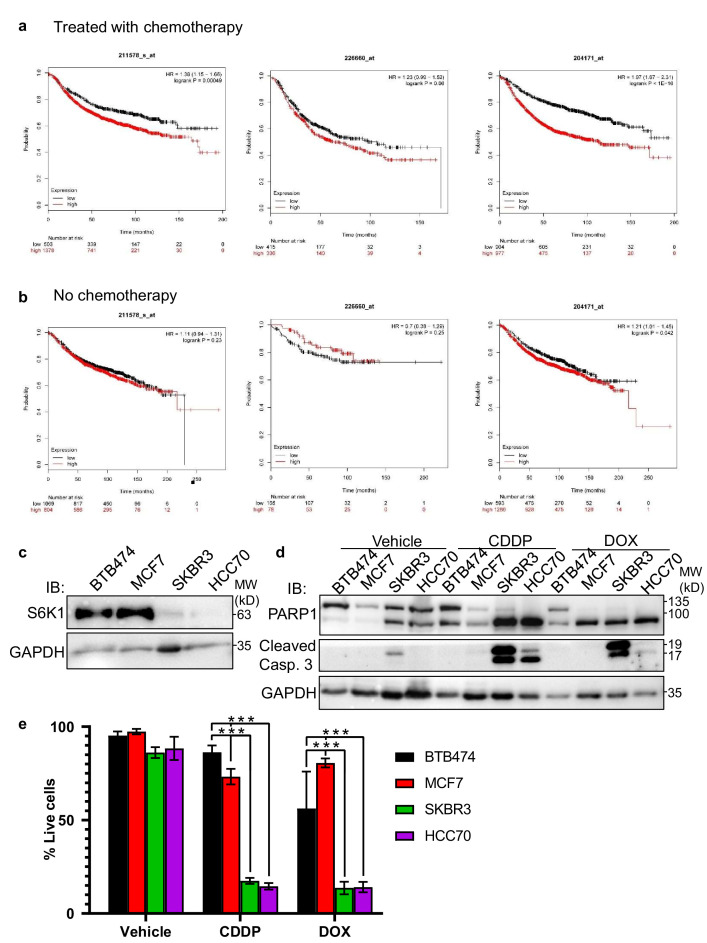
Figure 1—figure supplement 2. RPS6KB1 expression is a poor prognosis marker for breast cancer patients and cell lines treated with chemotherapy.

Figure 1—figure supplement 2.

(a) Kaplan-Meier survival plots of breast cancer patients treated with chemotherapy with relation to S6K1 expression in their tumors. Data using three different probe-sets from Affymetrix array are shown. (b) Kaplan-Meier survival plots of breast cancer patients not treated with chemotherapy with relation to S6K1 expression in their tumors. Data using three different probe-sets from Affymetrix array are shown. Data was taken from http://kmplot.com/analysis/. (c) Western blot showing the expression of S6K1 in four different breast cancer cell lines (BTB474, MCF7, SKBR3, and HCC70). (d,e) BTB474, MCF7, SKBR3, and HCC70 cells were exposed to either DMSO (vehicle), 25 mM cisplatin (CDDP) or 1 mg/ml doxorubicin (DOX) for 24 hr. Western-blot analysis (d) and trypan-blue exclusion assay (e) are shown. Data represents means ± SD of six replicates. *** p<0.001, comparing BTB474 cells to MCF7, SKBR3, or HCC70 cells. p values were calculated using Student’s t-test (two-tailed).
Figure 1—figure supplement 2—source data 1. Western bots of Figure 1—figure supplement 2.
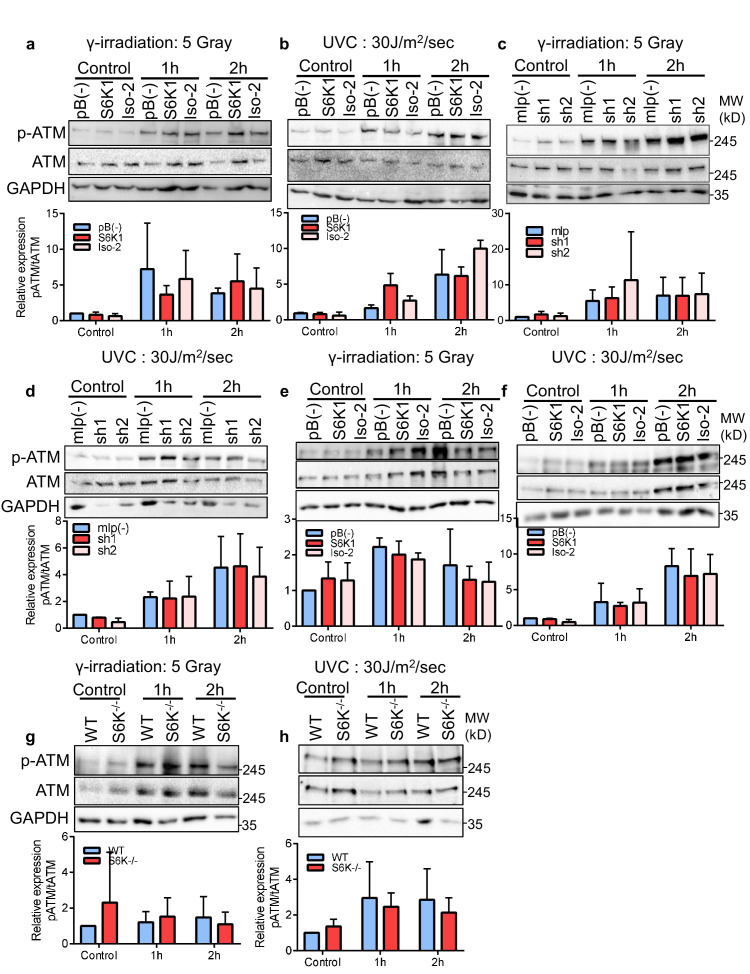
Figure 1—figure supplement 3. S6K1 does not affect ATM levels or phosphorylation state.

Figure 1—figure supplement 3.

(a–d) Western blot analysis of MCF-10A cells transduced with retroviruses encoding either empty vector pBABE (pB(-)), S6K1 or Iso-2 (a,b) or empty vector (mlp(-)), S6K1-specific shRNAs (sh1, sh2) (c,d). Cells were irradiated with either γ-irradiation 5 Gray (a,c) or UVC 30 J/m2/s (b,d) and harvested 1 or 2 hr after irradiation. (e–h) Western blot analysis of MEF S6K-/- cells and WT MEFs (g,h) or MEF S6K-/- cells transduced with retroviruses encoding either empty vector pBABE (pB(-)), S6K1 or Iso-2 (e,f). Cells were irradiated with either γ-irradiation 5 Gray (e, g) or UVC 30 J/m2/s (f, h) and harvested 1 or 2 hr after irradiation. The quantitation is shown in a bar graph below each panel. Data represents means + SD of triplicates. *p<0.05 values were calculated using Student’s t-test (two-tailed).
Figure 1—figure supplement 3—source data 1. Western blots of Figure 1—figure supplement 3.