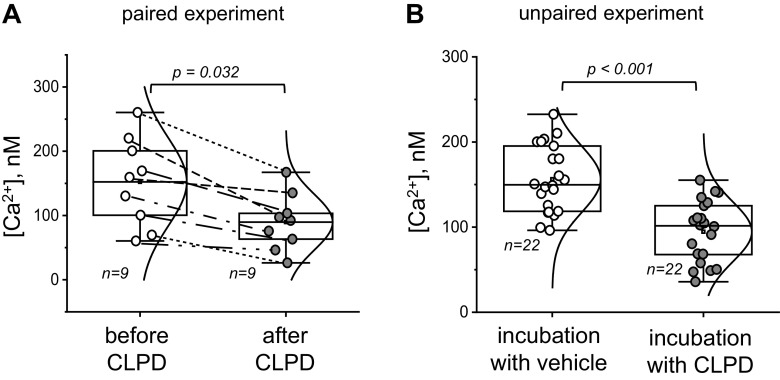
Figure 1.
Effect of clopodavin (CLPD) on basal calcium levels in primary fakeocytes. A: basal calcium level recorded in the cells before and after CLPD treatment. Statistical analysis was performed with a Student’s paired t test (normal distribution of the data was tested with the Kolmogorov-Smirnov test). Please note that paired data points are connected by lines to illustrate the consistency of the fall in calcium concentration ([Ca2+]) in response to the drug. B: basal calcium level in the cells following a 1-h incubation with vehicle or CLPD. Statistical analysis was performed using a Student’s two-sample t test (normal distribution of the data was tested with the Kolmogorov-Smirnov test). There were three experimental replicates (independent dishes with cells) in A and B; no effect of the dish is assumed, and data points from individual regions of interest are reported (n is shown on the graph). No data were excluded from the analysis; exact P values (if the data are significantly different) are shown on the graphs unless the P value is <0.001. The boxes on the graphs represent the 25th and 75th percentile boundaries, and the error bars mark the minimum and maximum values of the data set.

