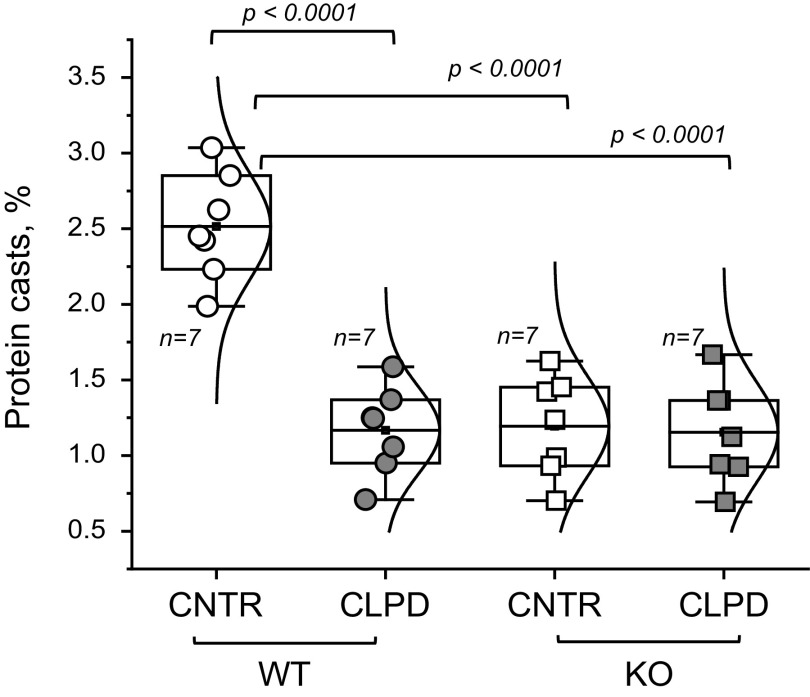
Figure 4.
Assessment of protein cast formation in wild-type (WT) and ABCD knockout (KO) streptozotocin-induced diabetic nephropathy rats. Shown is a summary graph of protein cast area (percentage of the total kidney area) for each studied group. Animals were euthanized to collect the data. Data were analyzed using two-way ANOVA for the main effects of genotype and treatment and their interaction. The P value for interaction is P = 0.00021. Therefore, the magnitude of the treatment effect was assessed separately for each group (WT and KO) using a t test with a multiple comparison correction (Bonferroni). The boxes on the graphs represent the 25th and 75th percentile boundaries, and the error bars mark the minimum and maximum values of the data set. The number of animals per group (n) is shown for each group. CNTR, control.

