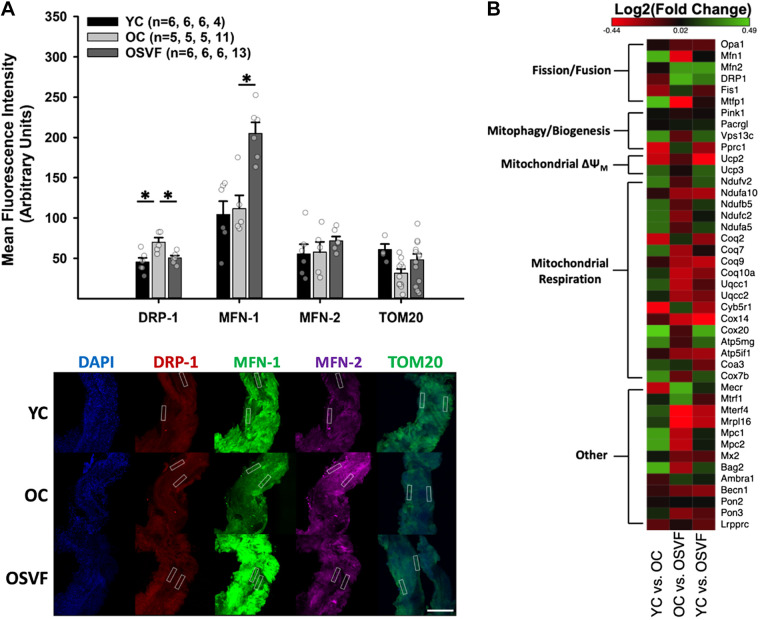
Figure 1.
Coronary microvascular genetic and protein expression related to mitochondrial function. Protein expression for fission (DRP-1), fusion (MFN-1 and MFN-2), and mitochondrial density (TOM20) with representative images. White boxes represent regions of interest placed only on the vessel wall excluding cardiomyocytes; MFI was measured only in these regions, with left and right vessel wall MFI averaged for each image (A). RNA sequencing of genetic expression associated with mitochondrial function (B). Significance determined as *P < 0.05 with one-way ANOVA and Bonferroni post hoc analysis. Scale bar = 200 µm. RNA sequencing heatmap created using Morpheus, https://software.broadinstitute.org/morpheus. MFI, mean fluorescence intensity.

