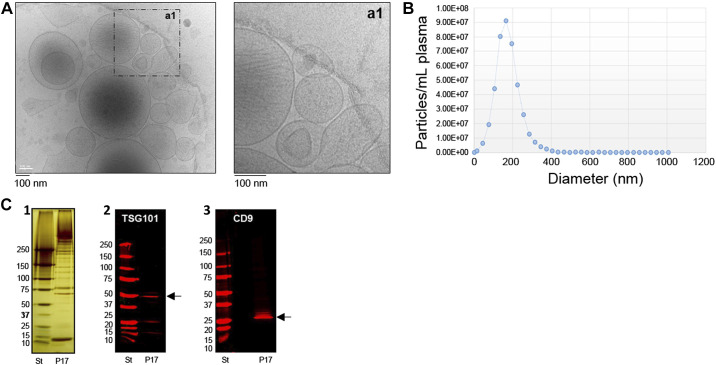
Figure 2.
Basic EV characterization. This figure summarizes the basic characterization of extracellular vesicles (EVs) enriched for analysis in this study from platelet poor plasma with differential centrifugation. A: provides cryo-electron microscopy images in low and high resolutions. EVs of various sizes and densities are present. The higher magnification shows also the bilipid layers of EVs studied here. B: shows an example of a particle detection with Nanosight tracking analysis (NTA) using “Zetaview by Particle matrix.” The mean size of EVs in this example is 174.2 nm (median 161.8 nm and mode 171.8 nm) and the majority of EVs is less than 200 nm in size. For all other samples size and phenotype of single EVs are detected with flow cytometry (see Fig. 1C for gating strategy and also information about fluorescence and light scatter calibration for sizing which is provided in the Supplemental information (FCM pass report, MiFlowcyt check list; available: https://doi.org/10.6084/m9.figshare.20045723.v1). C: summarize results of Western blotting analysis of enriched EV pellets with differential centrifugation. The left image (C1) shows a silverstain of protein content of the EV pellet [here enriched with differential centrifugation (P17 pellet)] and a standard (ST). EV antigens such as TSG101 (C2) and CD9 (C3) are present in this P17 pellet.

