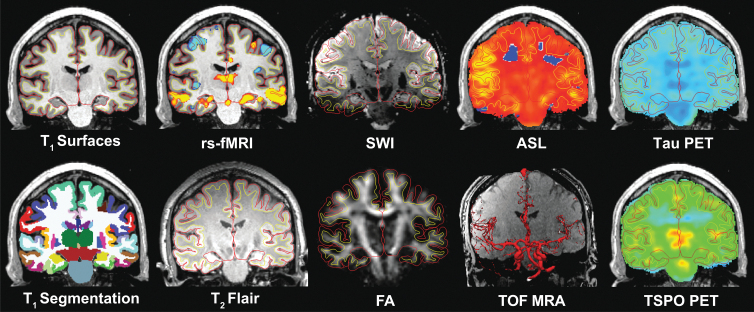
FIG. 3.
Multi-modal integration of neuroimaging data. MRI and PET data are coregistered and segmented using FreeSurfer tools, allowing precise neuroanatomic correlation of lesions and abnormal signals across modalities. The red line indicates the pial surface, and the yellow indicates the cortical gray-white matter junction. In the T1 segmentation image, cortical and subcortical regions are segmented according to the Desikan-Killiany atlas.139 FA, fractional anisotropy; ASL, arterial-spin labeled perfusion imaging; MRA, magnetic resonance angiography; PET, positron emission tomography; rs-fMRI, resting-state functional MRI; SWI, susceptibility-weighted imaging; T1, T1-weighted; T2 FLAIR, T2-weighted fluid-attenuated inversion recovery; TOF, time of flight; TSPO, translocator protein.

