
Figure 1.
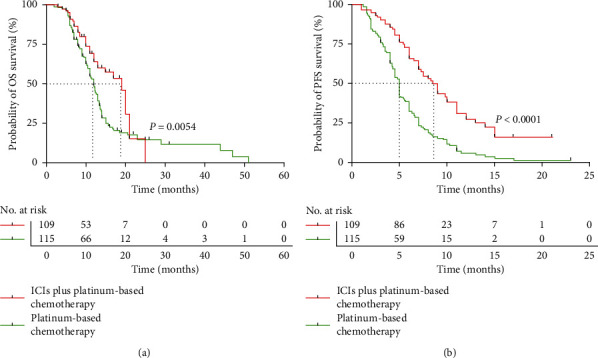
Overall survival (OS) and progression-free survival (PFS) in the ICIs combination chemotherapy cohort and only chemotherapy cohort. (a) Kaplan–Meier graph of OS in the two groups. (b) Kaplan–Meier graph of PFS in the two groups.
Official websites use .gov
A
.gov website belongs to an official
government organization in the United States.
Secure .gov websites use HTTPS
A lock (
) or https:// means you've safely
connected to the .gov website. Share sensitive
information only on official, secure websites.
Overall survival (OS) and progression-free survival (PFS) in the ICIs combination chemotherapy cohort and only chemotherapy cohort. (a) Kaplan–Meier graph of OS in the two groups. (b) Kaplan–Meier graph of PFS in the two groups.