Figure 4.
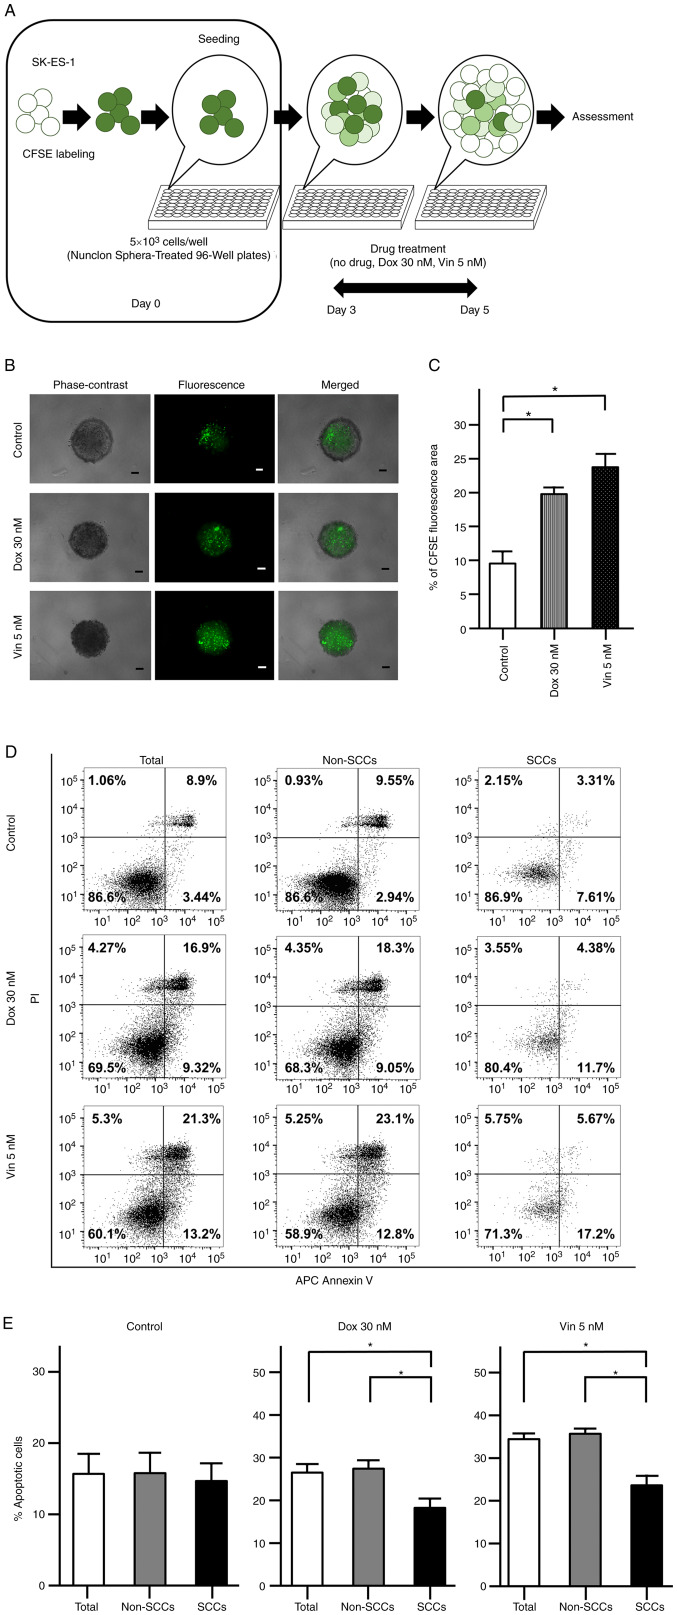
Chemoresistance of CFSE-labeled SK-ES-1 cells. (A) Schematic diagram evaluating the chemoresistance of CFSE-labeled SK-ES-1 cells. (B) Representative phase-contrast, fluorescence and merged images of spheres derived from CFSE-labeled SK-ES-1 cells. Scale bars, 100 µm. (C) Percentage of the CFSE fluorescence area following 2 days of drug treatment. The error bars indicate the standard error of the mean. *P<0.05. (D) Apoptosis assays by dual staining with APC Annexin V and PI using flow cytometry. The percentage of the cells was calculated after 2 days of drug treatment in each fraction: Left lower panel, APC Annexin V-negative/PI-negative; right lower panel, APC Annexin V-positive/PI-negative; left upper panel, APC Annexin V-negative/PI-positive; right upper panel, APC Annexin V-positive/PI-positive. (E) Percentage of apoptotic cells after 2 days of drug treatment in total cells, non-SCCs and SCCs in the SK-ES-1 cell line. The error bars indicate the standard error of the mean. *P<0.05. CFSE, carboxyfluorescein diacetate succinimidyl ester; Dox, doxorubicin; PI, propidium iodide; SCCs, slow-cycling cells; Vin, vincristine.

