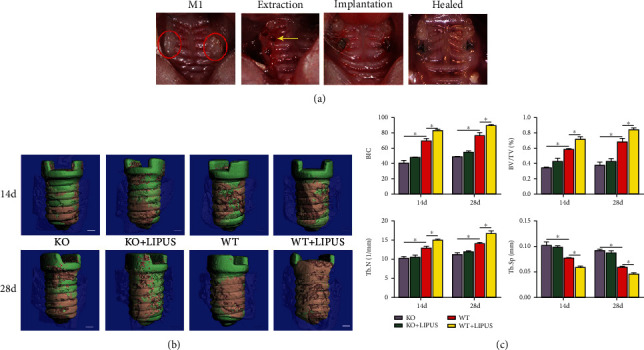
Figure 1.

LIPUS enhanced the osseointegration of dental implant in αCGRP+/+ mice. (a) Tooth extraction and implant placement procedure. The red circles indicate bilateral maxillary first molars. The yellow arrow points to the palatal root socket after tooth extraction. (b) Three-dimensional reconstruction of the implant by microcomputed tomography (micro-CT). The green area indicates implant, and the pink area indicates BIC. Scale bars = 100 mm. (c) Micro-CT analysis of BIC, BV/TV, Tb.N, and Tb.Sp. Data are presented as means ± standard deviation. ∗P < 0.05, n = 4 specimens/group. KO: αCGRP knockout mice; WT: wild type; BIC: bone–implant contact; BV/TV: bone volume/tissue volume fraction; Tb.N: mean trabecular number; Tb.Sp: mean trabecular separation. Reprinted from Jiang et al. [24], Copyright (2020), with permission from Elsevier.
