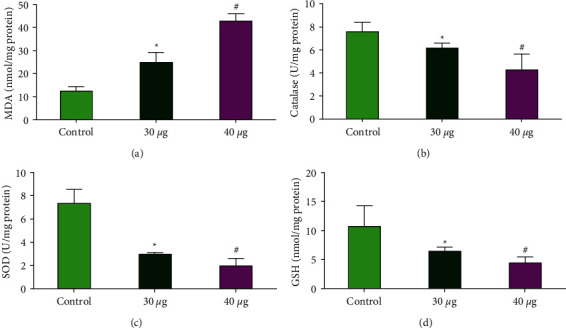
Figure 10.

Antioxidant enzymes SOD, CAT, GSH, and MDA were persuaded by CTCANc in MOLT4 cell line. Active MDA (a), CAT (b), SOD (c), and GSH (d) levels were measured colorimetrically in the MOLT4 cell line after 24 hours of treatment at 30 and 40 μg/ml dosages. The data were provided as SOD, CAT, GSH, and MDA enzyme activity and mean SD (n = 3). Statistical significance is indicated by ∗p < 0.05 and #p < 0.001 in contrast to the “control” group.
