Figure 1.
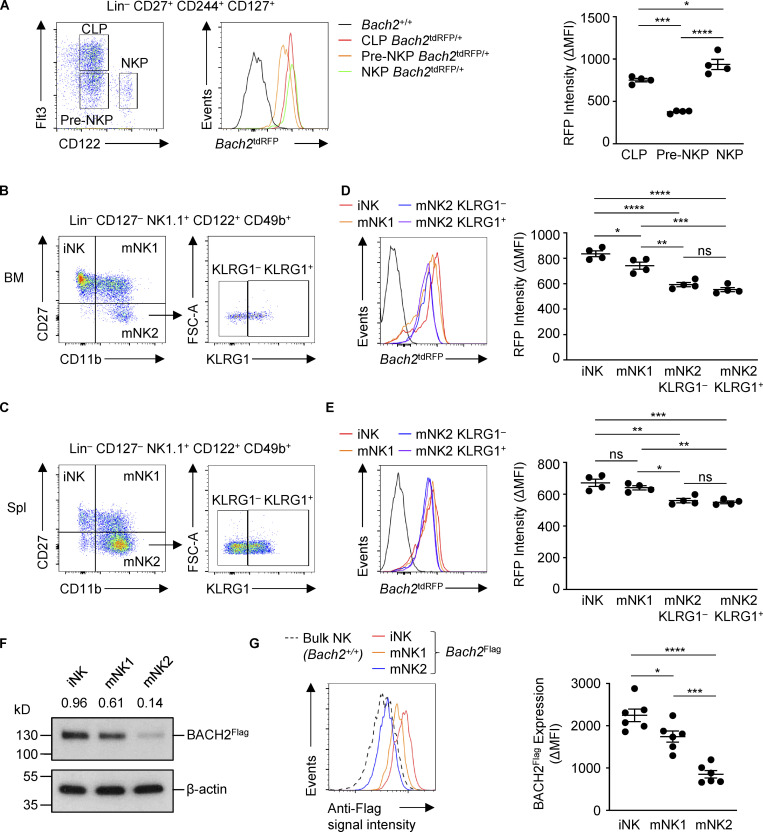
Expression of Bach2 in developing and mature NK cells. (A) Flow cytometry of Bach2tdRFP expression by NK cell progenitors within BM (left) and replicate measurements (right). (B and C) Gating strategy for progressive NK cell maturation states from the BM (B) and spleen (C). (D) Bach2tdRFP expression (left) and replicate measurements (right) in NK cell subsets defined in B from mice of indicated genotypes. (E) Bach2tdRFP expression (left) and replicate measurements (right) in the NK cell subsets defined in C from mice of indicated genotypes. (F) Immunoblot analysis of BACH2 expression in NK cell subsets sorted from Bach2Flag animals using an anti-Flag antibody. Numbers show relative expression when compared to an anti–β-actin control. (G) Flow cytometry of Bach2Flag expression in subsets of NK cells from the spleen (left) and replicate measurements (right). Bach2tdRFP expression is plotted as ΔMFI (mean fluorescence intensity), calculated as the difference between RFP signal in samples from Bach2tdRFP/+ animals compared to the mean RFP signal from WT controls (D–E). BACH2Flag expression is plotted as ΔMFI, calculated as the difference between anti-Flag signal in Bach2Flag animals and the mean WT control signal. Data representative of two independent experiments with four to six mice per group (A–E and G). ns, not significant (P > 0.05); *, P ≤ 0.05; **, P ≤ 0.01; ***, P ≤ 0.001; ****, P ≤ 0.0001. Ordinary one-way ANOVA (D, E, and G). Bars and error are mean and SEM.

