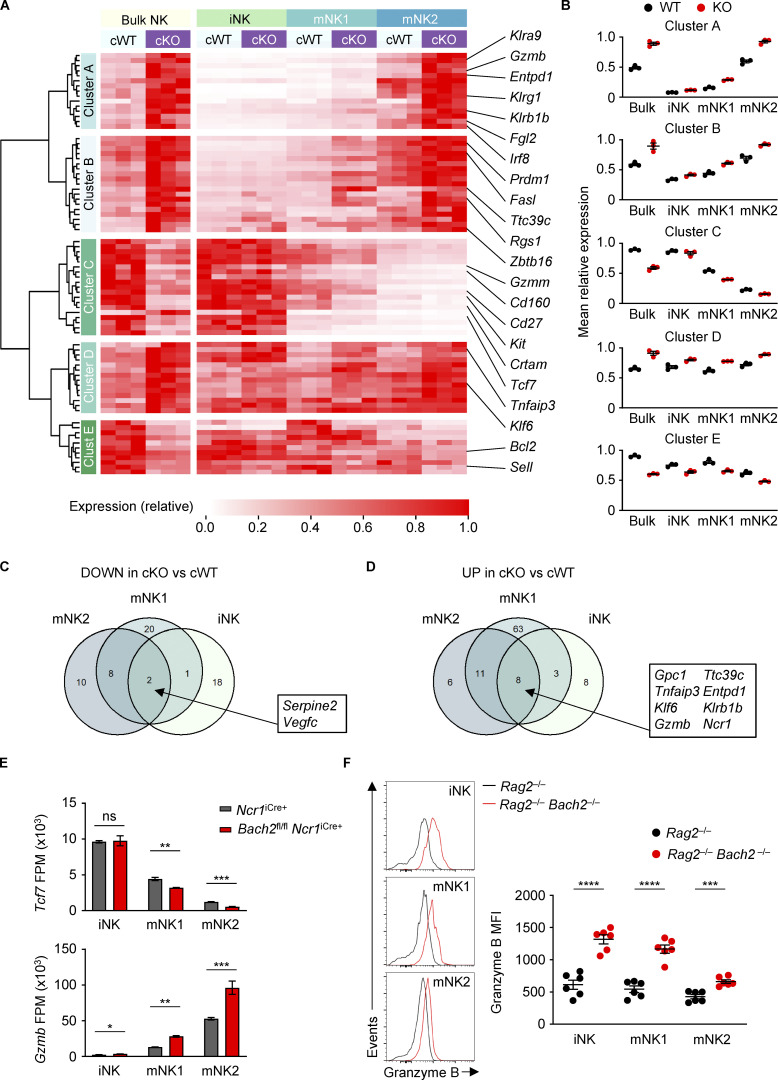
Figure 3.
Regulation of the global NK cell maturation program by BACH2. (A) Heatmap showing differentially expressed genes between NK cells sorted from Bach2fl/fl Ncr1iCre+ (cKO) mice and Ncr1iCre+ (cWT) controls (Padj ≤ 0.2). Also shown is the expression of these genes in NK cell maturation subsets sorted from the same animals. cWT/cKO bulk NK samples and cWT/cKO NK subset gene expression (fragments per million; FPM) independently normalized to row maxima. Genes are hierarchically clustered on the y axis. Data are representative of three biological replicates per group. (B) Average gene expression within the five identified clusters from A in cWT and cKO NK cells and NK cell subsets. (C) Venn diagram showing the overlap between significantly downregulated genes in NK cell maturation subsets sorted from cKO compared to cWT animals. (D) Venn diagram showing the overlap between significantly upregulated genes in NK cell maturation subsets sorted from cKO compared to cWT animals. (E) Normalized expression of selected genes in NK cell subsets sorted from cWT and cKO animals. (F) Representative histograms of Granzyme B expression (left) and replicate measurements of Granzyme B MFI (right) in indicated cell subsets from Rag2−/− and Rag2−/− Bach2−/− animals (six mice per group). ns, not significant (P > 0.05); *, P ≤ 0.05; **, P ≤ 0.01; ***, P ≤ 0.001; ****, P ≤ 0.0001. RNA-Seq from three independent biological replicates per genotype is shown. Unpaired two-tailed Student’s t test. Bars and error are mean and SEM.

