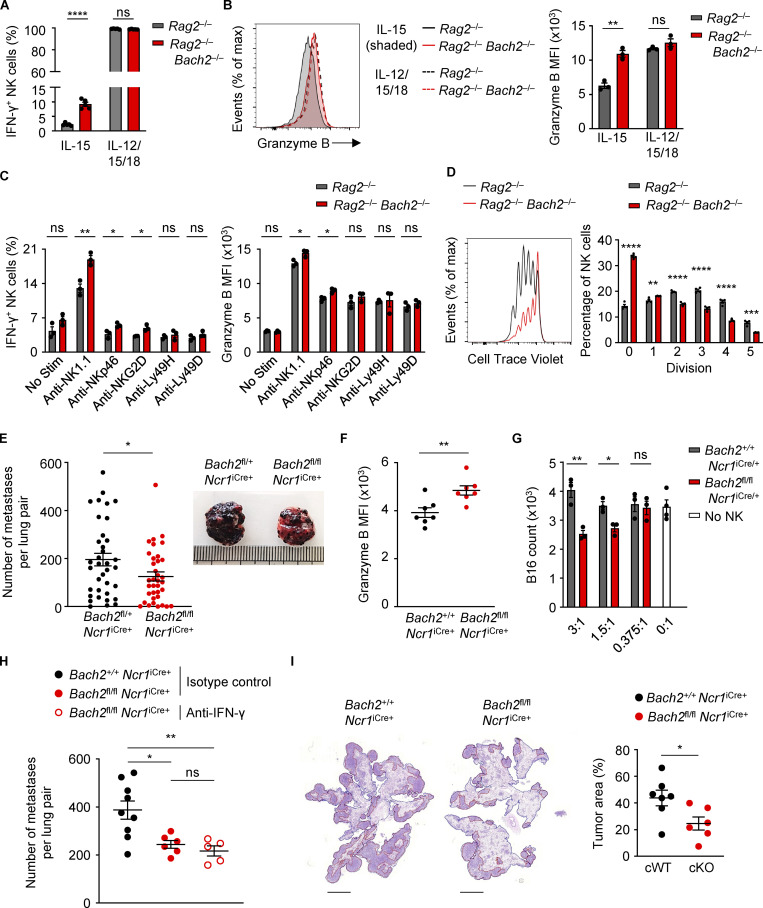
Figure 5.
BACH2 maintains NK cell quiescence and restricts immune surveillance to pulmonary metastasis. (A) Replicate measurements of the percentage of IFN-γ+ NK cells sorted from the spleens of mice with indicated genotypes after 4 d of culture in indicated conditions. (B) Representative Granzyme B expression (MFI; left) and replicate measurements (right) of NK cells sorted from the spleens of mice with indicated genotypes after 4 d of culture in indicated conditions. (C) Replicate measurements of the percentage of IFN-γ+ NK cells (left) and NK cell Granzyme B expression (right) after sorting from the spleens of mice with indicated genotypes and 16 h of culture in indicated conditions. (D) Representative plot (left) showing CTV staining and replicate measurements (right) of the percentage of NK cells at each stage of division after isolation from the spleens of Rag2−/− and Rag2−/− Bach2−/− mice by FACS and following 4 d in culture with IL-15. (E) Frequency of B16 metastases on the lobular surfaces (left) and representative photographs (right) of lungs from mice of indicated genotypes 16 d after intravenous injection of B16 cells. Data pooled from five representative experiments with six to eight mice per group. (F) Granzyme B expression (MFI) of lung NK cells from conditional KO animals and relevant controls 16 d following intravenous injection of B16 cells. (G) Counts of B16 cells after overnight co-culture in indicated ratios with NK cells sorted from mice of indicated genotypes. (H) Frequency of B16 metastases on the pleural surfaces of lungs from mice of indicated genotypes and treated intraperitoneally with the indicated antibodies 15 d following intravenous injection of B16 cells. (I) Representative images (left) and quantification of relative tumor area to total lung area (right) of metastases within lungs of mice of indicated genotypes 13 d after intravenous administration of syngeneic LL/2 cells. Relative percentage of total cross-sectional lung area occupied by cancer metastases is shown. Scale bar = 3,000 µm. Data representative of two independent experiments (A, B, D, G, and I). Data from three to five technical replicates (A–D and G) or five to nine mice per group (F–I). ns, not significant (P > 0.05); *, P ≤ 0.05; **, P ≤ 0.01; ***, P ≤ 0.001; ****, P ≤ 0.0001. Unpaired two-tailed Student’s t test. Bars and error are mean and SEM.

