Figure S2.
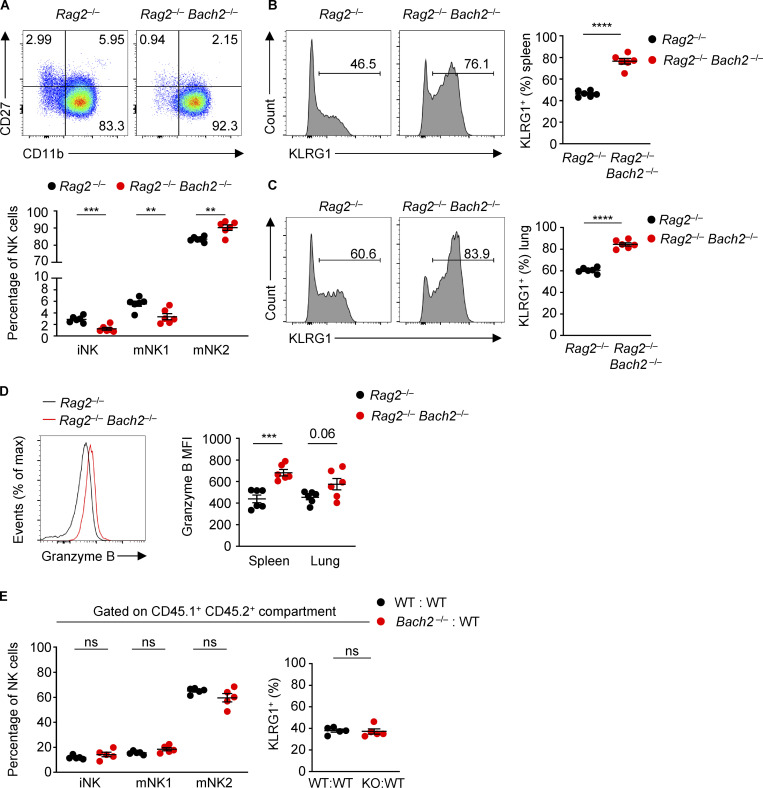
Regulation of NK cell maturation by BACH2. (A) Representative plots of CD27 and CD11b expression (top) and percentages of NK cells of indicated phenotypes (bottom) within NK cells from spleens of Rag−/− and Rag−/− Bach2−/− mice. (B) Representative histograms (left) and replicate measurements (right) of KLRG1 expression on splenic NK cells from mice of indicated genotypes. (C) Representative histograms (left) and replicate measurements (right) of KLRG1 expression on lung NK cells from mice of indicated genotypes. (D) Representative Granzyme B expression (MFI) in splenic NK cells (left) and replicate measurements in spleen and lung NK cells (right) from mice of indicated genotypes. (E) Percentage of NK cells of indicated phenotypes (left) and KLRG1 expression on NK cells (right) within the CD45.1+ CD45.2+ NK compartments from the spleens of WT:WT (black dots) or Bach2−/−:WT (red dots) chimeras. Numbers in gates indicate percentages. Data representative of two independent experiments with five to six mice per group. ns, not significant (P > 0.05); **, P ≤ 0.01; ***, P ≤ 0.001; ****, P ≤ 0.0001. Unpaired two-tailed Student’s t test. Bars and error are mean and SEM.

