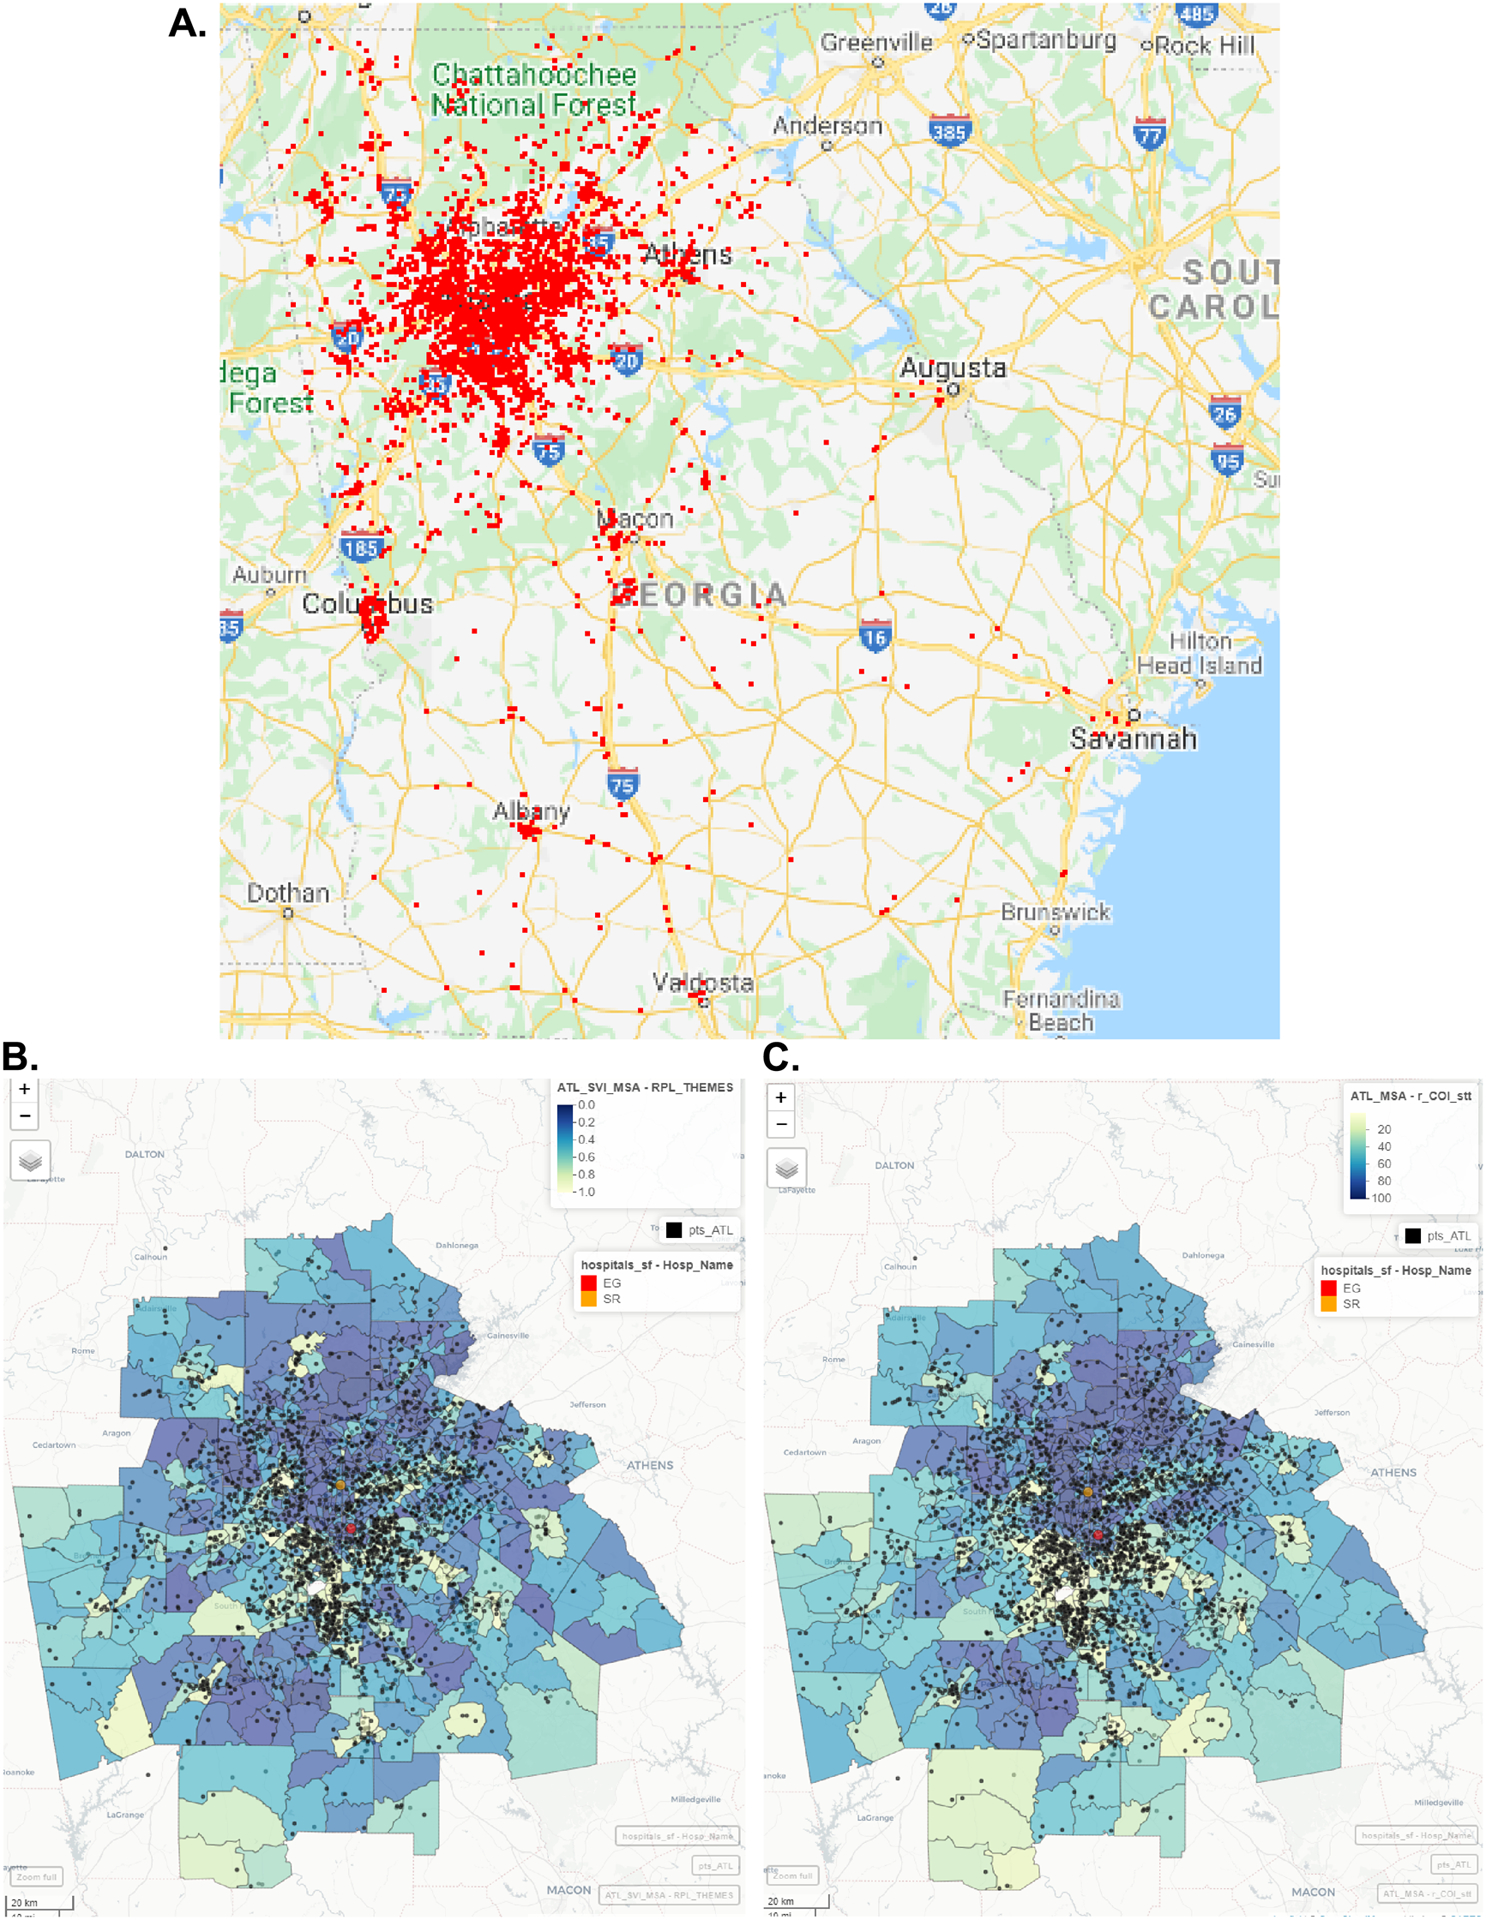
Figure 1. Distribution of children admitted to two Atlanta, Georgia pediatric intensive care units for acute respiratory failure requiring mechanical ventilation during the 2015 – 2020 study period.

A) Roadmap of Georgia with residences indicated by red dots. Choropleth maps of the Atlanta-Sandy Springs-Roswell metropolitan statistical area showing B) the Overall Social Vulnerability Index state-based rankings from 0 to 1, and C) the Overall Child Opportunity Index (COI) 2.0 state-based rankings from 1 – 100. Yellow indicates a census tract with a high (worse) SVI and low (worse) COI 2.0. Purple indicates a census tract with a low (better) SVI and high (better) COI 2.0. Black dots indicate individual residences. The Children’s Healthcare of Atlanta hospital with pediatric intensive care units are indicated by a red circle (Egleston campus) and an orange circle (Scottish Rite campus). The gray census tract south of Atlanta contains Hartsfield-Jackson International airport. It is colored gray because there is no SVI or COI index data for this tract.
