Fig. 3.

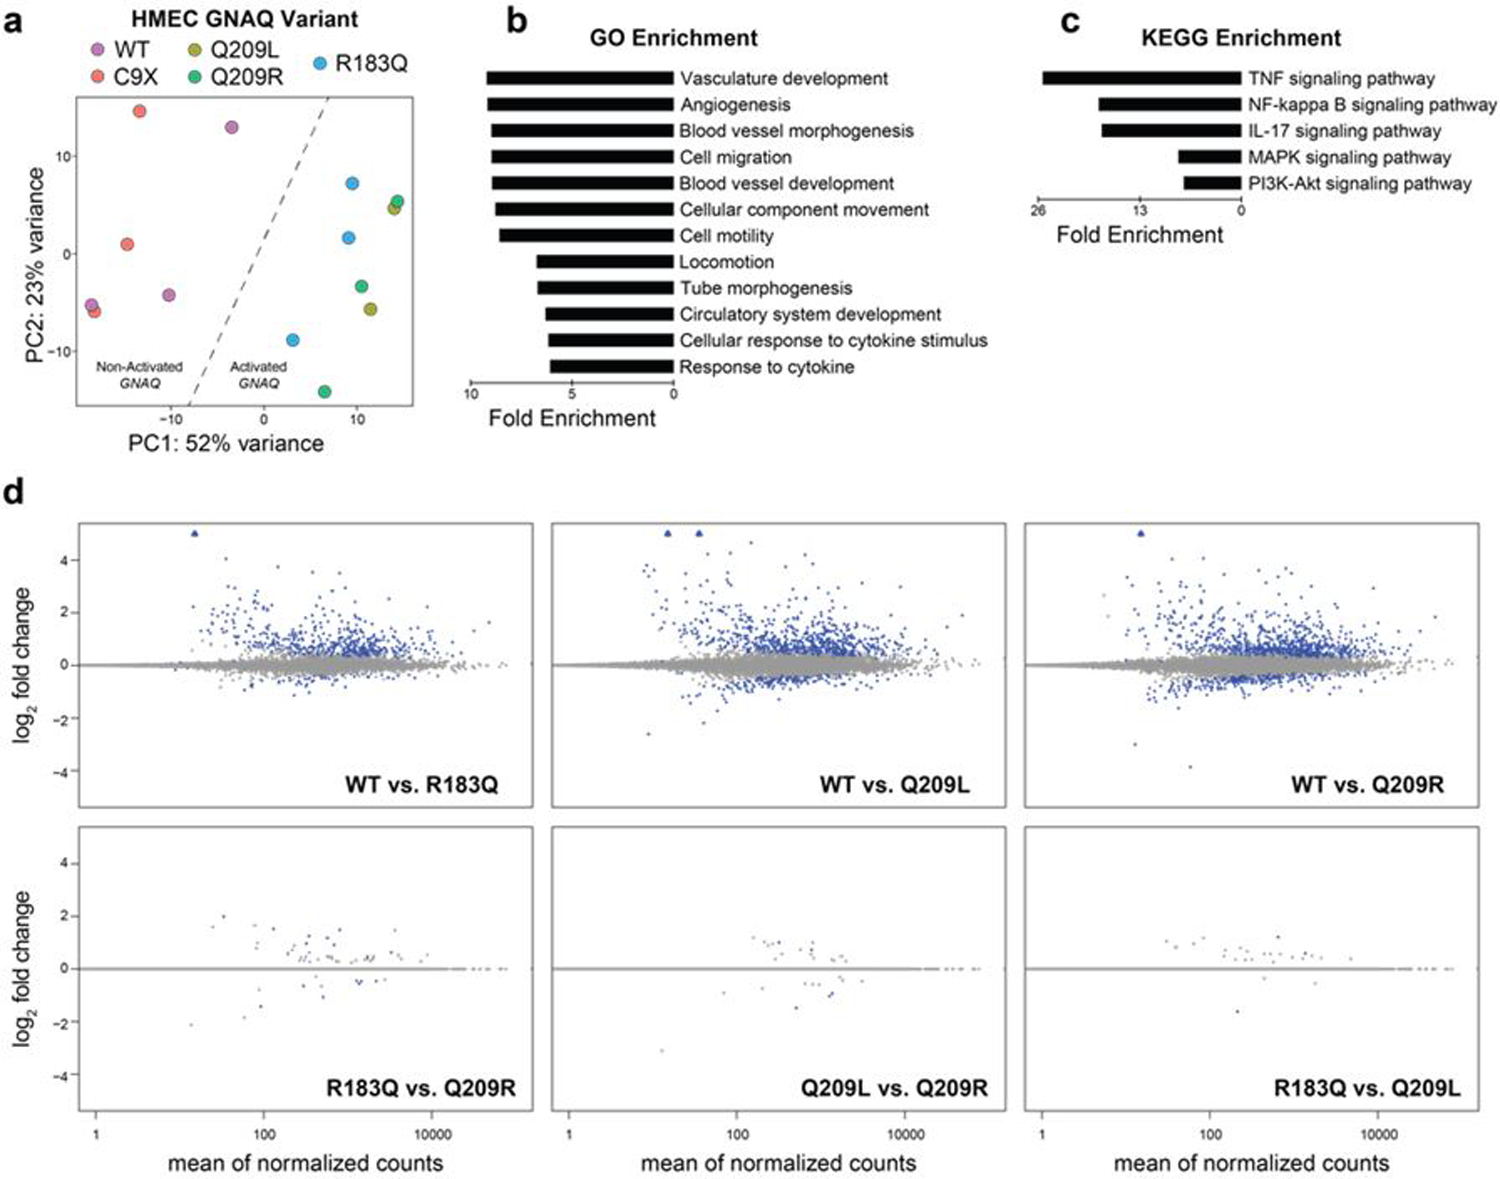
Activating mutations in GNAQ produce similar transcriptomic effects. (a) Principal component analysis of RNA-seq data produced from HMEC-1 cells transfected with WT or mutant GNAQ plasmids. (b, c) Top enriched terms for gene ontology (b) and KEGG signaling pathway (c) using the top 100 differentially expressed genes between WT and Q209R groups. Enriched terms are sorted by fold enrichment and all terms shown have p < 1E-5. (d) MA plots of RNA-seq data for pairwise comparisons between WT and mutant GNAQ (top) and comparisons between mutations (bottom). Blue circles are statistically significant DEGs, blue triangles are significant DEGs off the scale, grey circles are not significant
