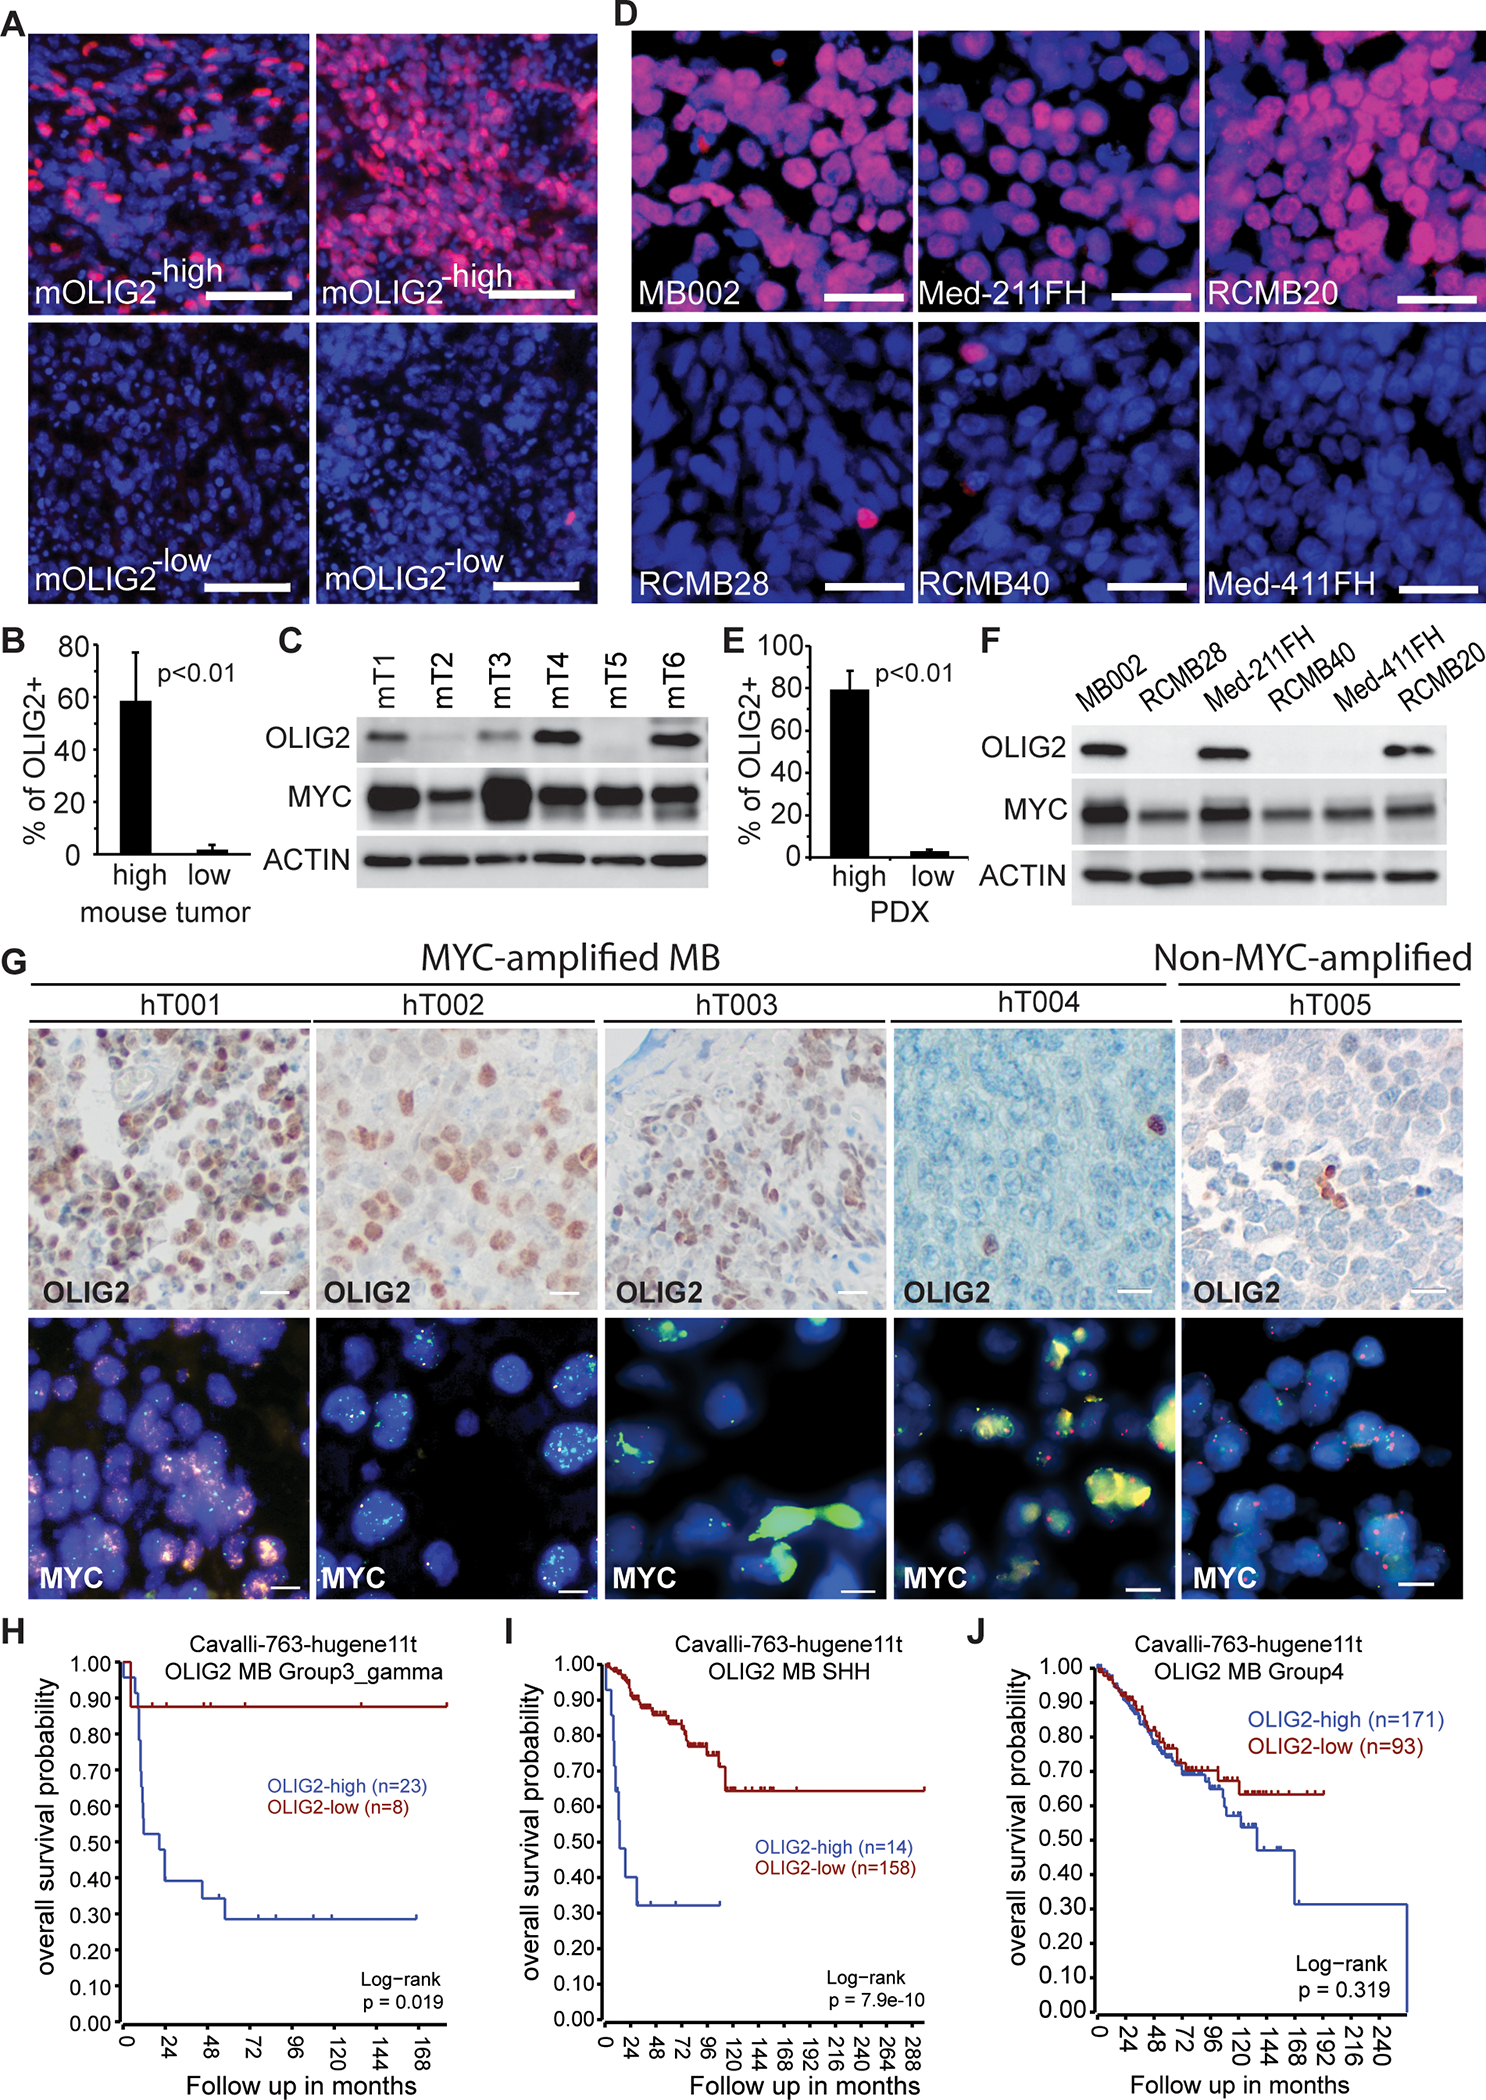
Figure 1. OLIG2 protein expression divides MYC-driven MB into two subgroups.

(A) Immunofluorescence histochemistry staining (IHC) of OLIG2 (red) in four representative mouse Myc-driven MB tumors. Nuclei counterstained with DAPI. Scale bars = 50 μm.
(B) Quantification of OLIG2+ cells in OLIG2high (n=5) and OLIG2low (n=5) mouse Myc-driven MB tumors. P values determined by Student T test.
(C) Western blot analysis of OLIG2 and MYC expression in six mouse MYC-driven MB tumors.
(D) IHC staining of OLIG2 (red) in MYC-amplified MB PDXs. Nuclei counterstained with DAPI. Scale bars = 25 μm.
(E) Quantification of OLIG2+ cells in OLIG2−high (MB002, Med-211FH and RCMB20) and OLIG2−low (RCMB28, RCMB40 and Med-411FH) human MYC-amplified MB PDX tumors. P values determined by Student T test.
(F) Western blot analysis of OLIG2 and MYC expression in MYC-amplified MB PDX tumors.
(G) OLIG2 or MYC expression in MYC-amplified MB tumors resected from patients, as assessed by IHC (scale bars = 25 μm) or FISH (scale bars = 10 μm).
(H-J) Correlation of OLIG2 expression with patient survival in Group 3γ MB, SHH-MB and Group 4 MB.
(See also Figure S1).
