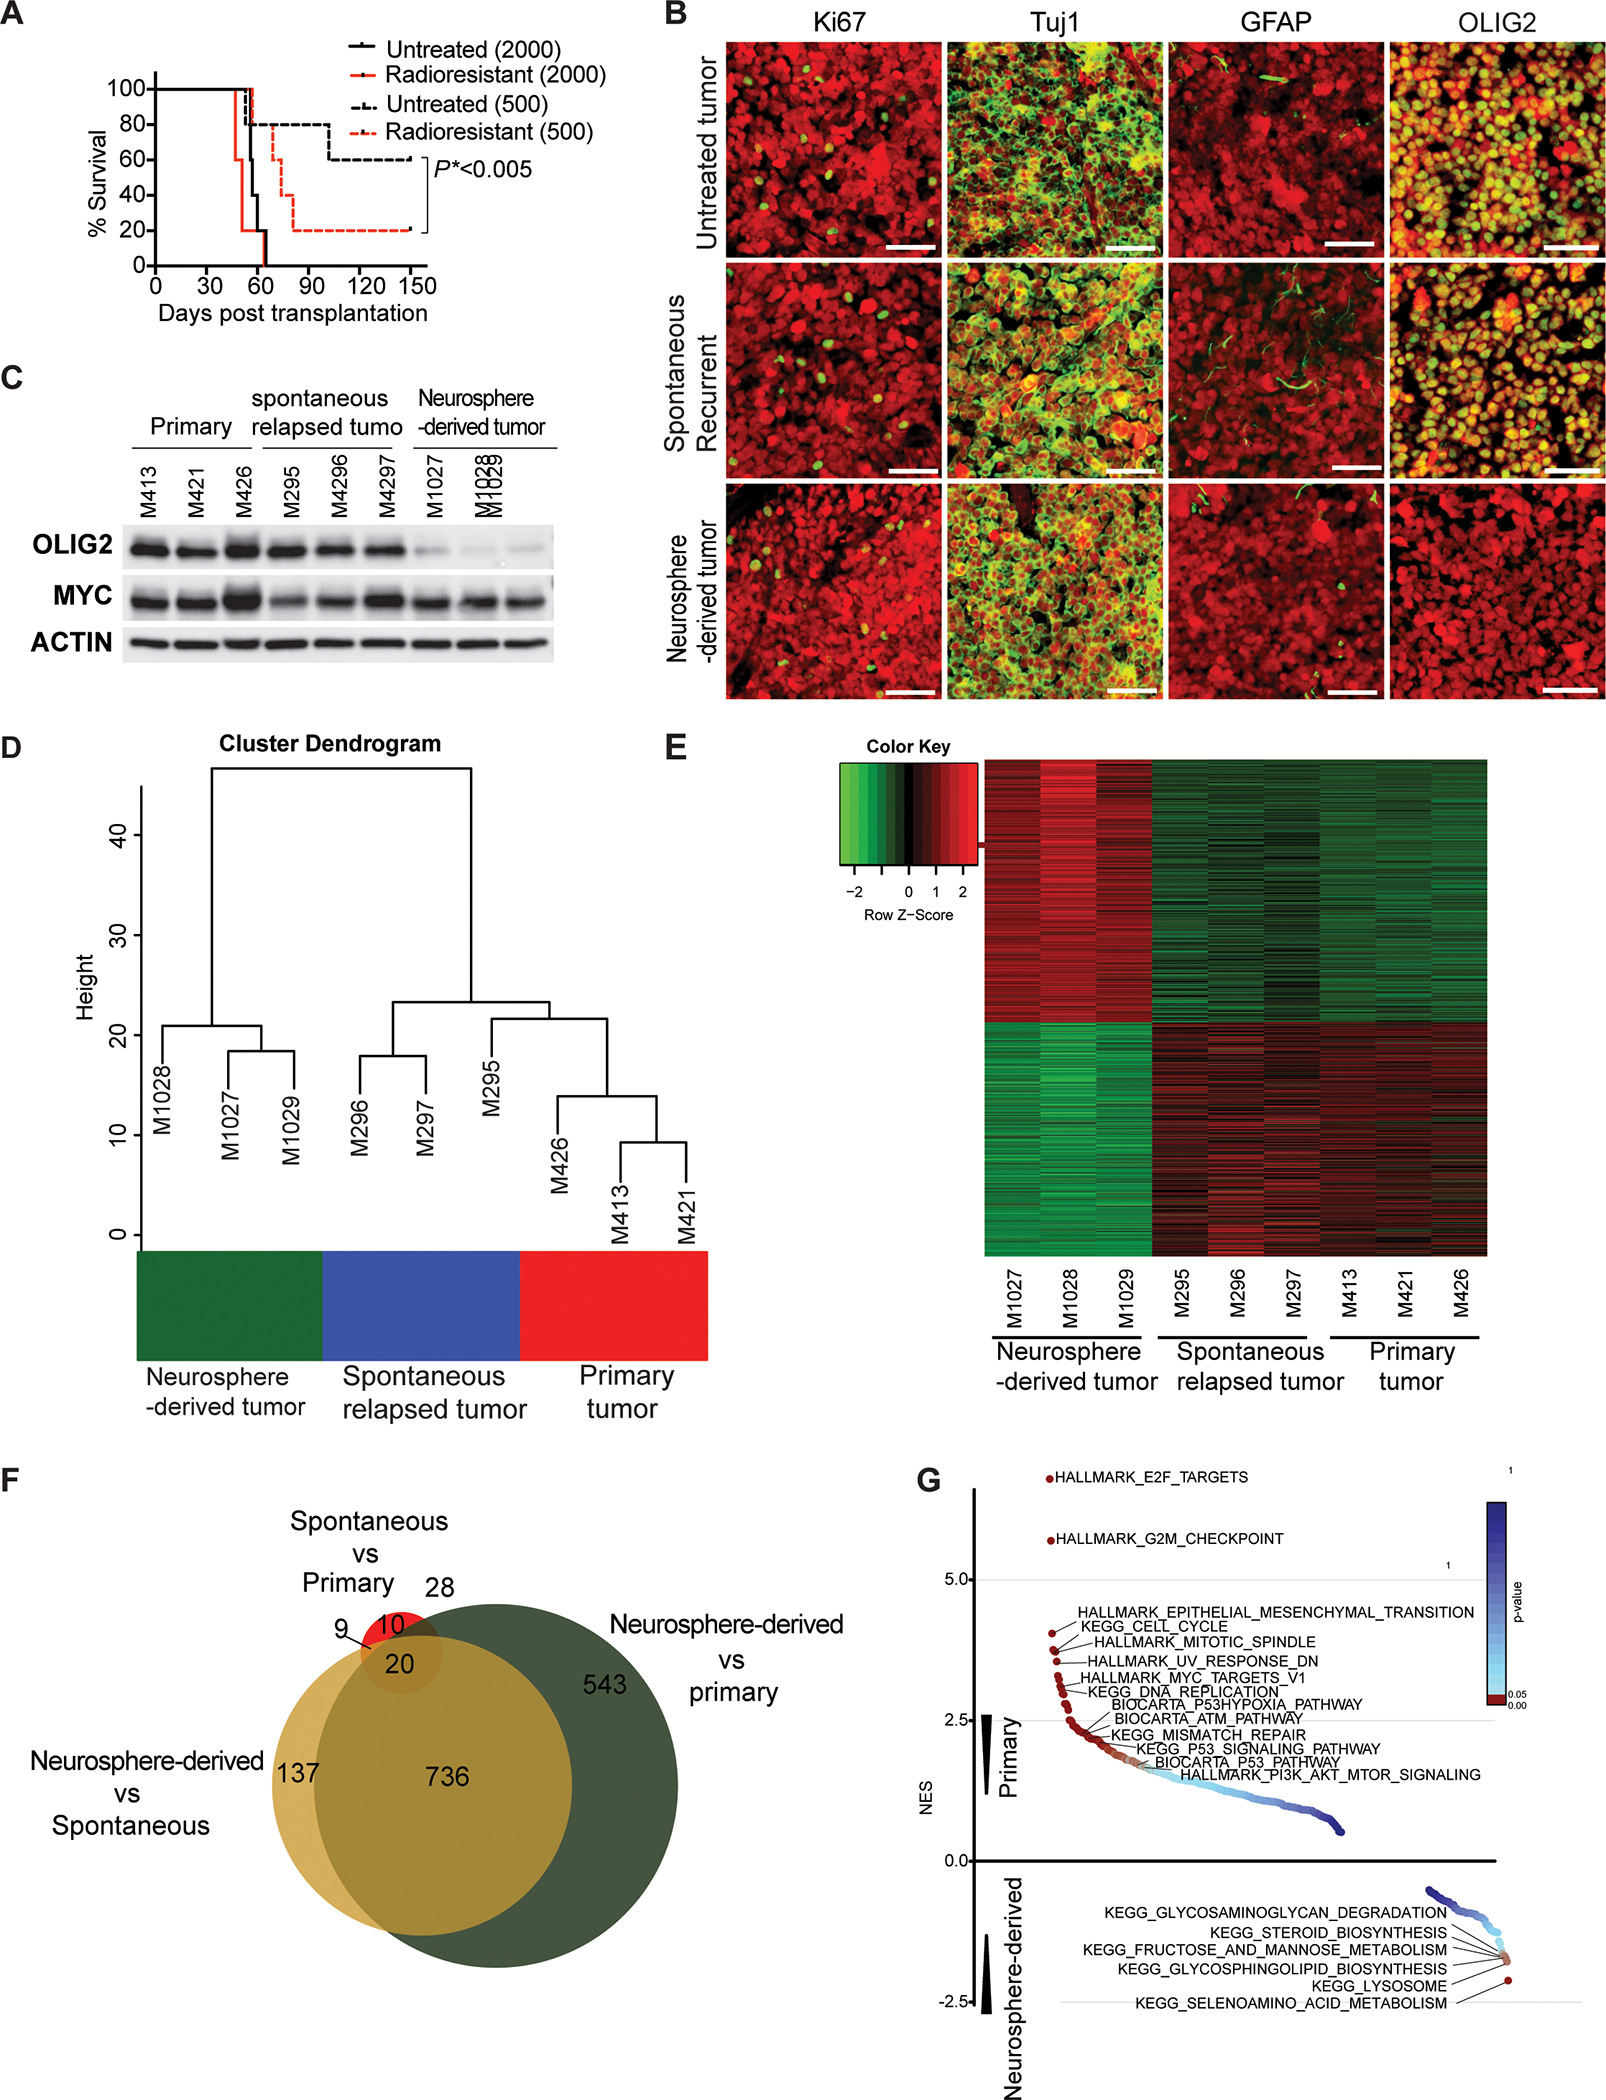
Figure 4. Characterization of the tumors derived from the radioresistant tumor cells in the cerebellar bed.

(A) Survival curves for animals transplanted with untreated cells or residual radioresistant neurospheres. Survival analysis was performed using Kaplan Meier. The p value was calculated for the radioresistant tumors compared to untreated tumors transplanted with 500 cells.
(B) IHC staining with antibodies (green) against Ki67, Tuj1, GFAP or OLIG2 in a post-irradiation neurospheres-derived tumor, spontaneously relapsed tumor, and primary tumor. Scale bars = 50 μm. Tumor cells are indicated in red (mCherry).
(C) Western blot analysis of OLIG2 and MYC expression in primary tumors, spontaneously relapsed tumors, and post-irradiation neurosphere-derived tumors.
(D, E) Unsupervised hierarchical clustering and heat map of batch effect adjusted primary tumors, spontaneously relapsed tumors, or post-irradiation neurosphere-derived tumors.
(F) Comparison of differential gene expression among primary tumors, spontaneously relapsed tumors, or post-irradiation neurosphere-derived tumors.
(G) Gene set enrichment analysis of primary tumors, spontaneously relapsed tumors, or post-irradiation neurosphere-derived tumors.
(See also Figures S3 and S4 and Table S1).
