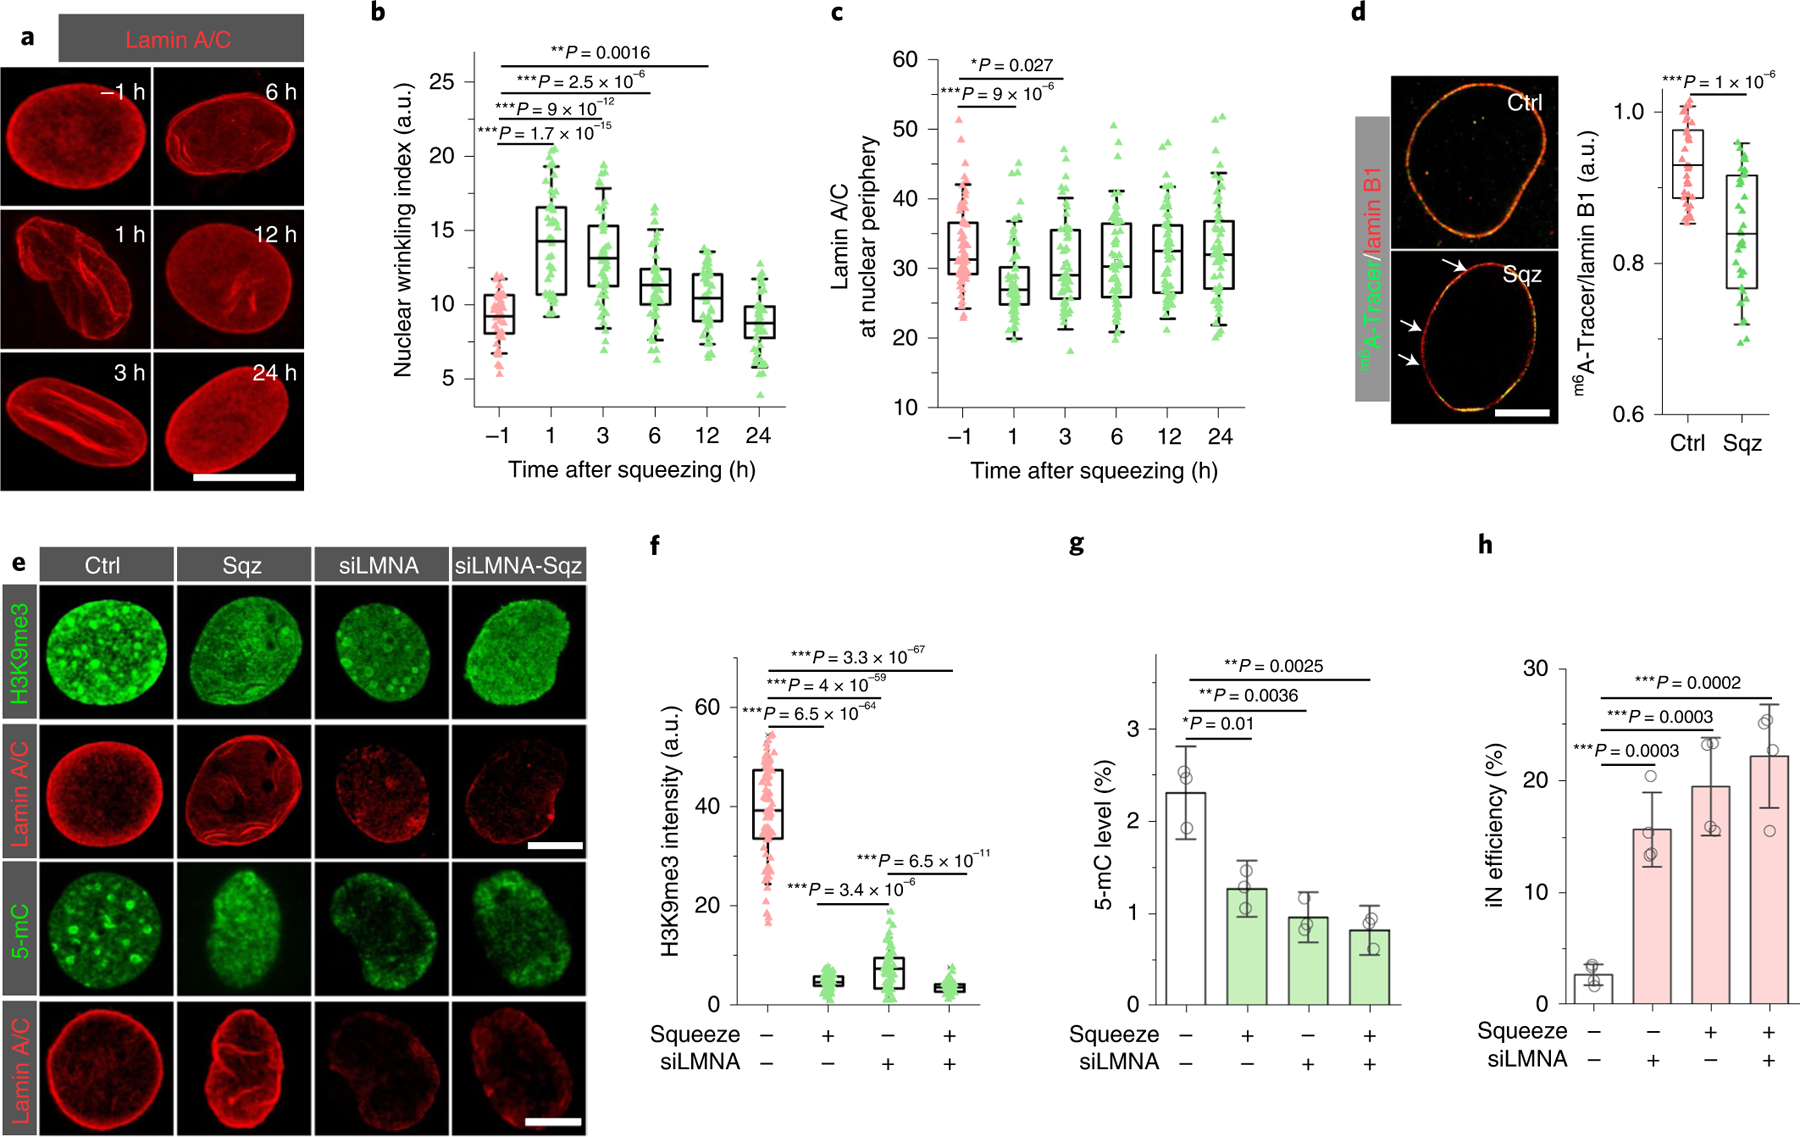
Fig. 4 |. Lamin A/C-mediated microchannel-induced epigenetic changes and iN reprogramming.

a, Representative images of lamin A/C staining in squeezed cells at the indicated time points after being squeezed by 7 μm microchannels. Scale bar, 10 μm. b, Quantification of nuclear wrinkling at the indicated time points before and after mechanical squeezing (n = 50). Nuclear wrinkling was defined as the immunofluorescence intensity of lamin A/C wrinkles within the nuclear region. Significance was determined by a one-way ANOVA and Tukey’s multiple comparison test. c, Quantification of lamin A/C at the nuclear periphery at the indicated time points before and after mechanical squeezing with 7 μm microchannels (n = 61). Significance was determined by a one-way ANOVA and Tukey’s multiple comparison test. d, Immunofluorescent images of lamin B1 and m6A-Tracer in control and squeezed fibroblasts at 3 hours after mechanical deformation. Scale bar, 5 μm. Bar graph shows the ratio of the signal intensity of m6A-Tracer and lamin B1 in the control and squeezed cells at 3 hours (n = 34). Significance was determined by a two-tailed, unpaired t-test. e, Immunostaining of H3K9me3 and 5-mC in cells treated with random siRNA and siRNA for lamin A (siLMNA) at 3 hours after mechanical squeezing (siLMNA-Sqz). Scale bars, 5 μm. f, Quantification of H3K9me3 intensity in control and squeezed cells after lamin A knockdown (based on experiments in e; n = 69). Significance was determined by a one-way ANOVA and Tukey’s multiple comparison test. g, Quantification of 5-mC level in control and lamin A-silenced fibroblasts at 3 hours after mechanical squeezing (n = 3). Significance was determined by a one-way ANOVA and Tukey’s multiple comparison test. h, Reprogramming efficiency of control and lamin A-silenced BAM-transduced fibroblasts at day 7 after mechanical deformation (n = 4). Significance was determined by a one-way ANOVA and Tukey’s multiple comparison test. In g and h, data represent mean ± s.d. In b, c, d and f, box plots show the ends at the quartiles and the mean as a horizontal line in the box, and the whiskers represent the s.d.
