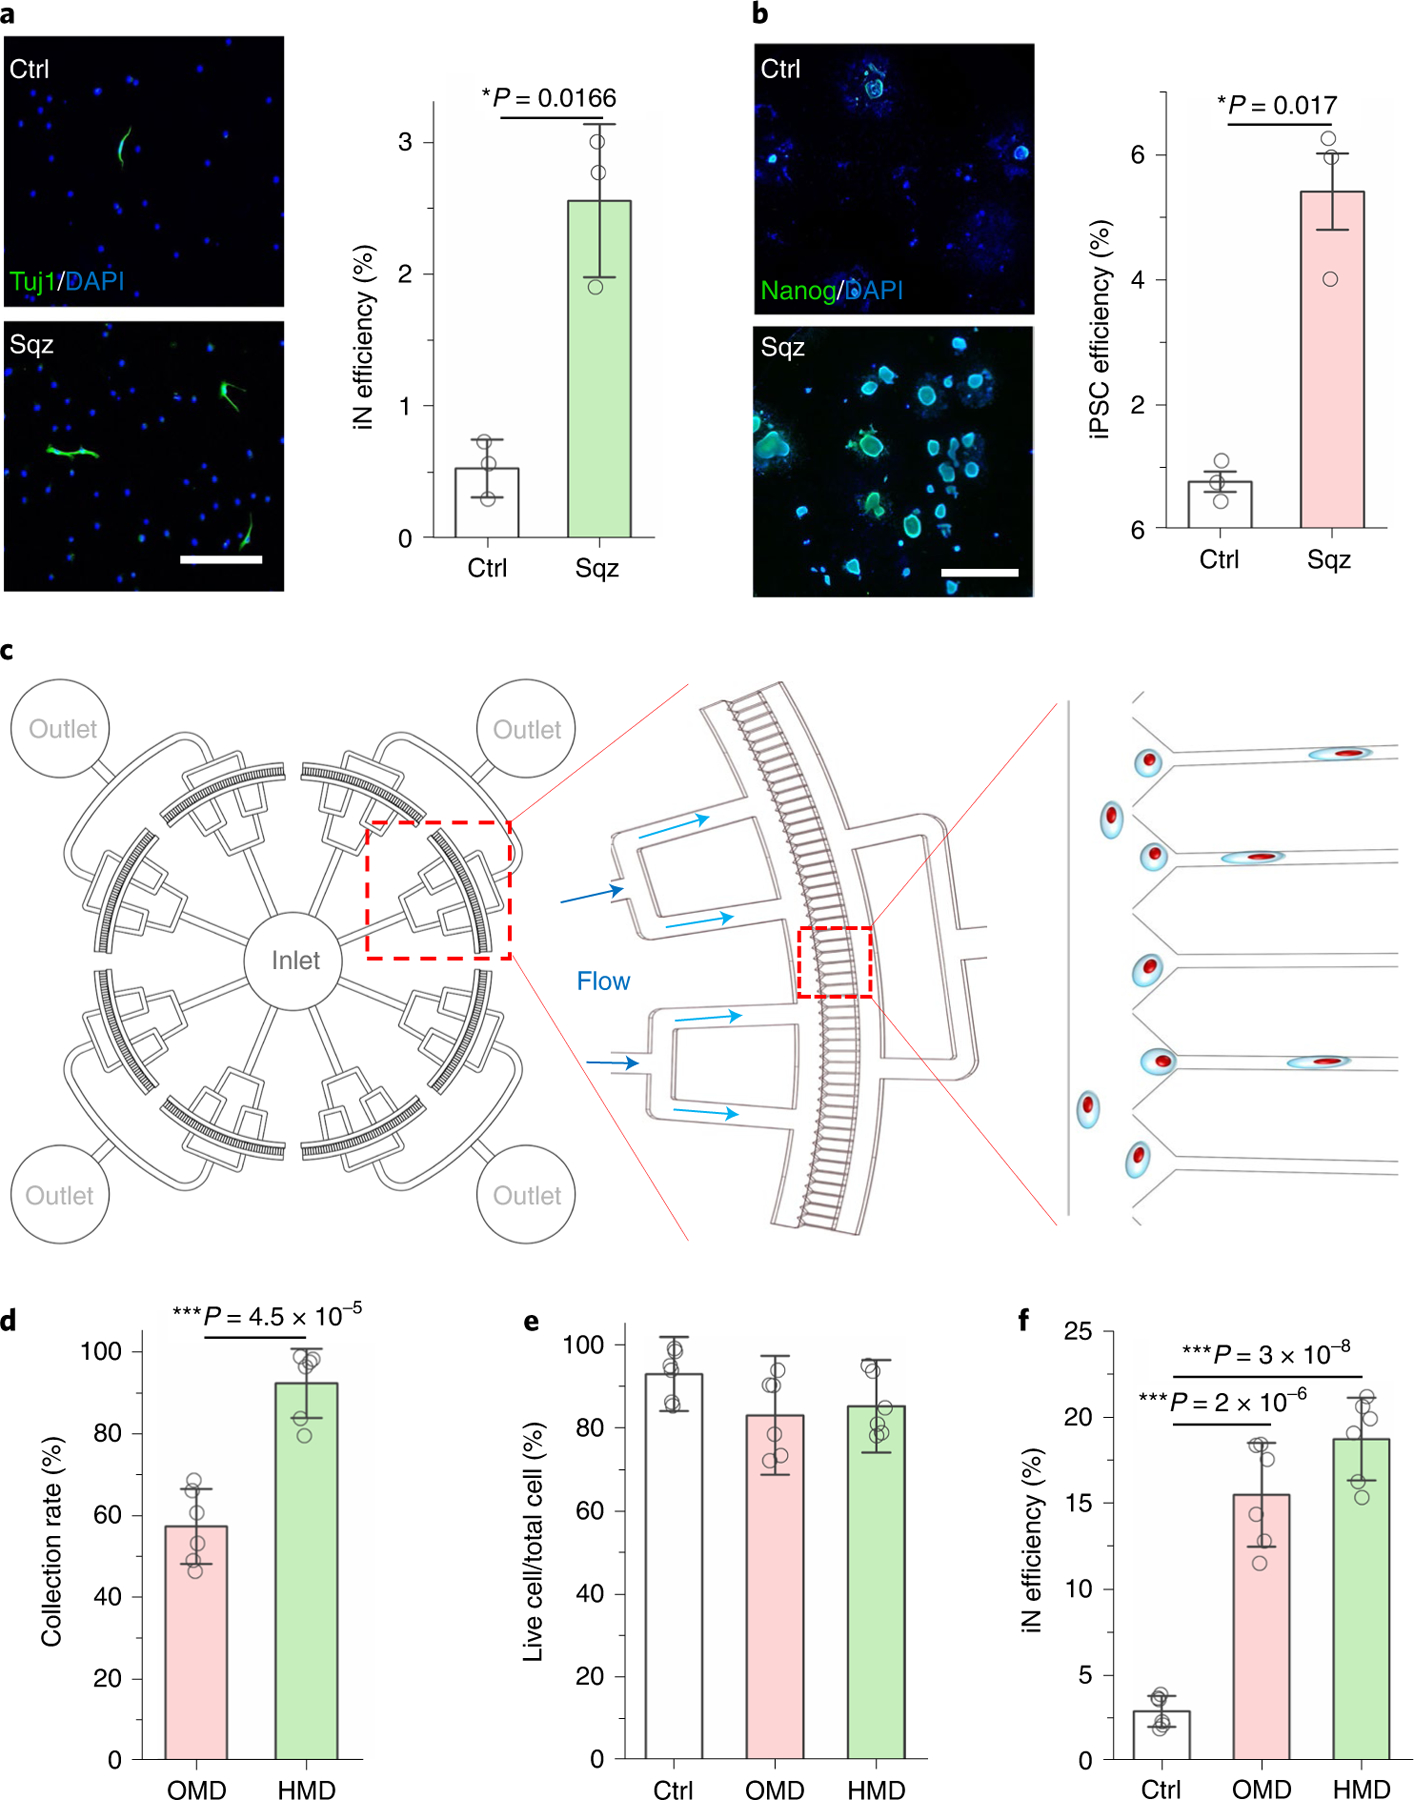
Fig. 5 |. Development of mechanical reprogramming technologies by nuclear deformation.

a, Immunofluorescent images show Tuj1+ iN cells generated from BAM-transduced mouse macrophages that were squeezed by 5 μm microchannels or flowed through 200 μm channels (Ctrl). Scale bar, 200 μm. Reprogramming efficiency of BAM-transduced macrophages after mechanical squeezing (n = 3). Statistical significance was determined by a two-tailed, unpaired t-test. b, Immunofluorescent images show Nanog+ colonies generated from OSKM-transduced mouse fibroblasts that were squeezed by 7 μm microchannels or flowed through 200 μm channels (Ctrl). Scale bar, 1 mm. Reprogramming efficiency of OSKM-transduced mouse fibroblasts into iPSCs after mechanical squeezing as determined by normalizing the number of Nanog+ colonies to the number of cells initially seeded (n = 3). Statistical significance was determined by a two-tailed, unpaired t-test. c, Schematic illustrating the design of the high-throughput device. d, Quantification of the percentage of cells that were collected after passing through OMD or HMD (n = 6). Statistical significance was determined by a two-tailed, unpaired t-test. e, The percentage of live cells after BAM-transduced fibroblasts were deformed using OMD or HMD, or flowed through 200 μm channels (Ctrl; n = 6). Significance was determined by a one-way ANOVA and Tukey’s multiple comparison test. f, Reprogramming efficiency of BAM-transduced fibroblasts that were either kept as a control or deformed (7 μm microchannels) using OMD or HMD at day 7 (n = 6). Significance was determined by a one-way ANOVA and Tukey’s multiple comparison test. Data in bar graphs represent mean ± s.d.
