
Fig. 3.
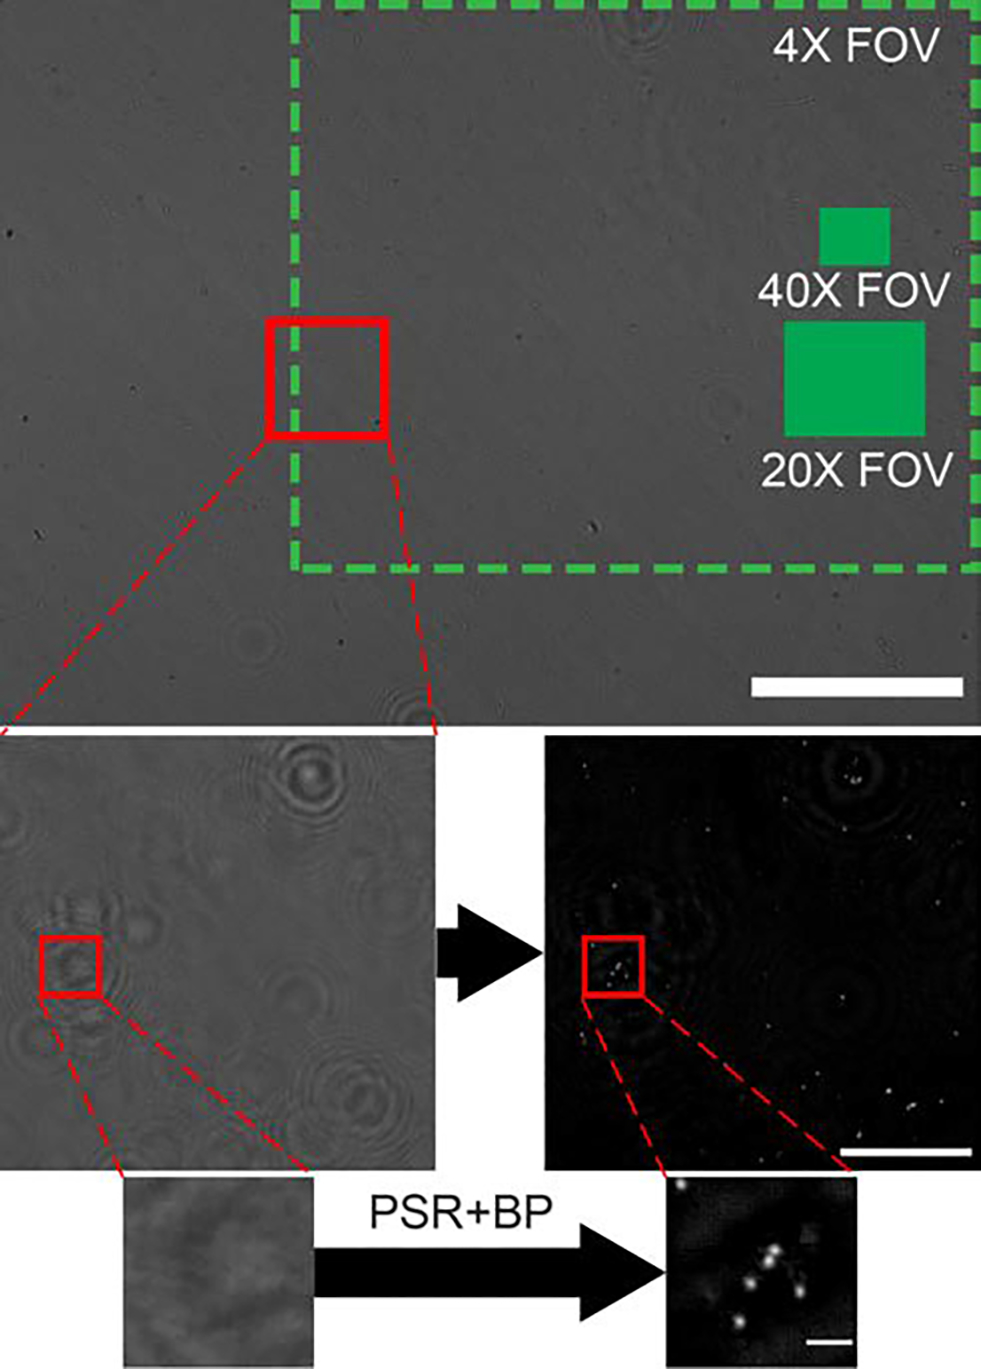
Image reconstruction process. The top image is a single LR hologram captured with the portable LFHM. Green boxes represent the FOV of a conventional microscope using different objective lenses. Scale bar = 1 mm. The second row is a small region of interest showing a comparison of a LR hologram (left) to the reconstructed HR image after PSR and back propagation (right). Scale bar = 100 μm. The bottom row is a further zoomed-in region of this image, depicting the LR hologram (left) and HR reconstruction of fully resolved beads (right). Scale bar = 10 μm.