
Figure 3.
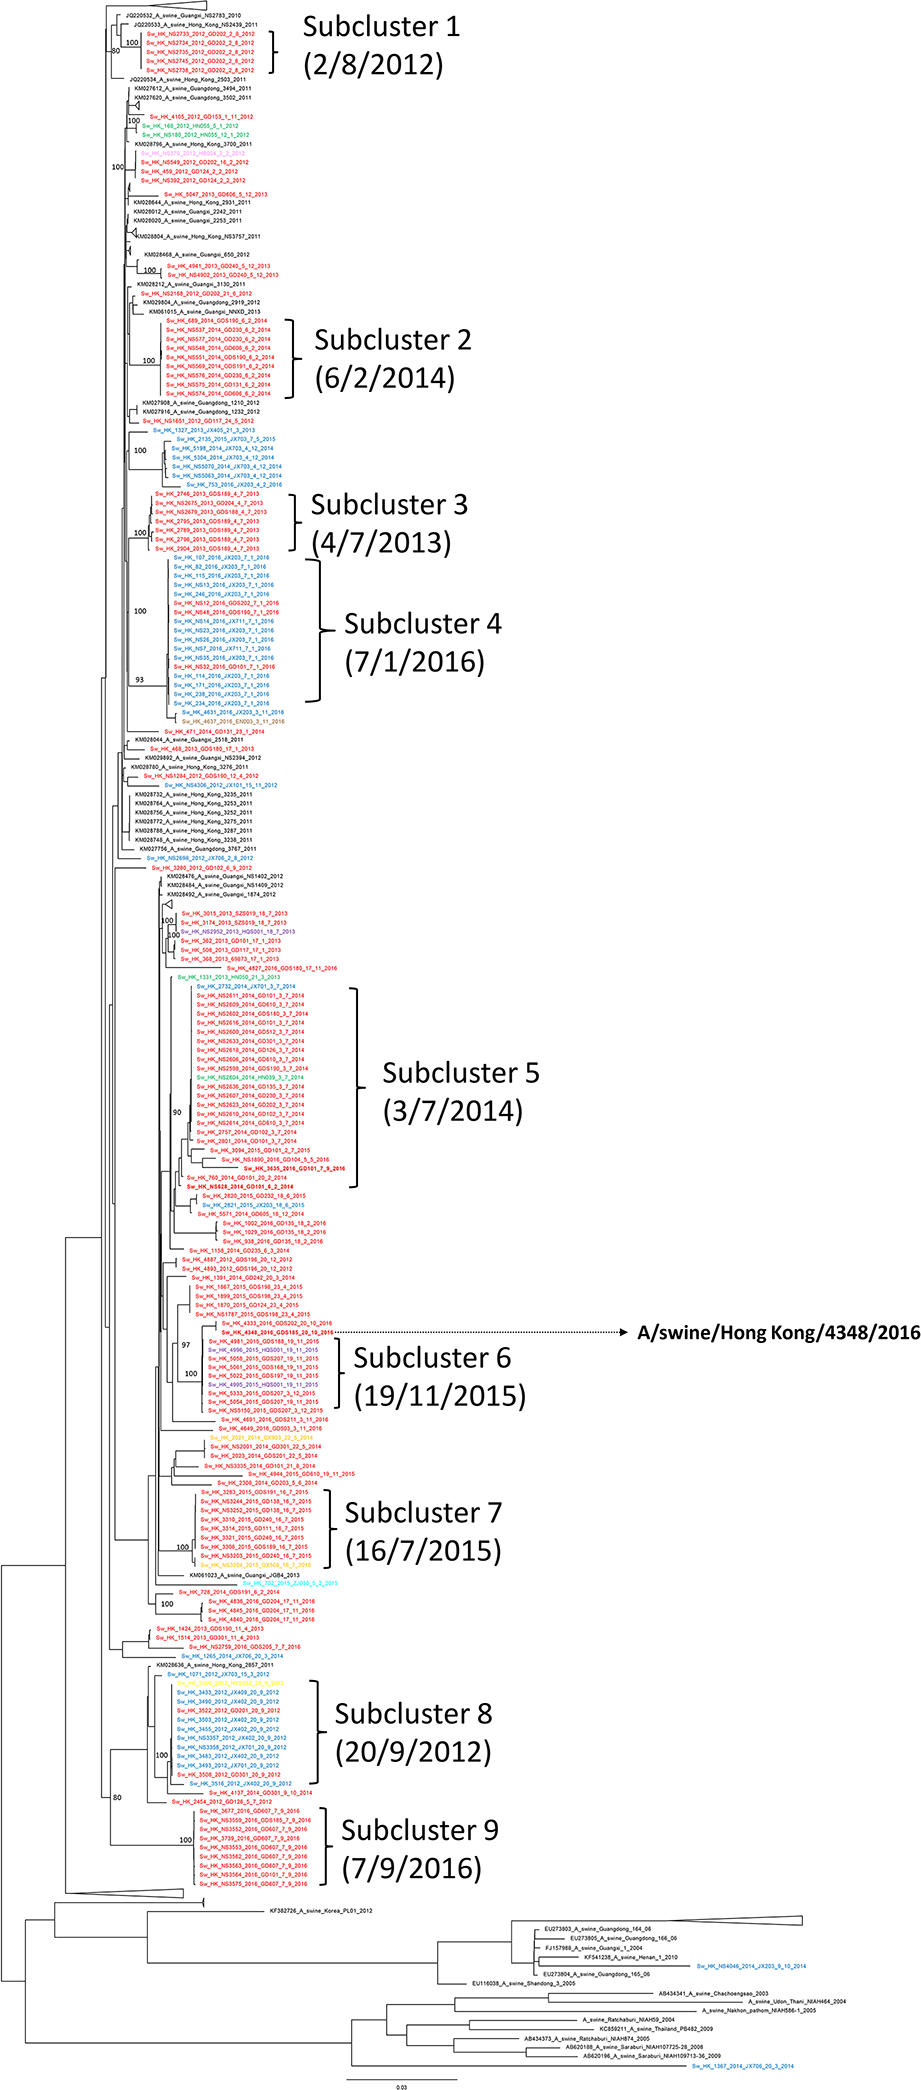
Maximum likelihood phylogenetic tree of 174 concatenated genomes of H3N2 swine influenza viruses in 2012–16. The tree was constructed using IQ-TREE using a GTR+F+R3 substitution model. Scale bar is given in numbers of substitutions per site and branch support aLRT statistics are shown at major nodes with value ≥ 0.8. Strain name is followed by pig tattoo codes and sampling date. Red: sequences from pigs from Guangdong and Shenzhen; Green: sequences from pigs from Hunan; Blue: sequences from pigs from Jiangxi; Orange: sequences from pigs from Guangxi; Cyan: sequences from pigs from Zhejiang; Pink: sequences from pigs from Hubei; Brown: sequences from pigs from Hainan; Yellow: sequences from pigs from Hebei; Black: other representative sequences from GenBank and GISAID. A/swine/Hong Kong/4348/2016 was selected as the representative strain for HAI test in this study.