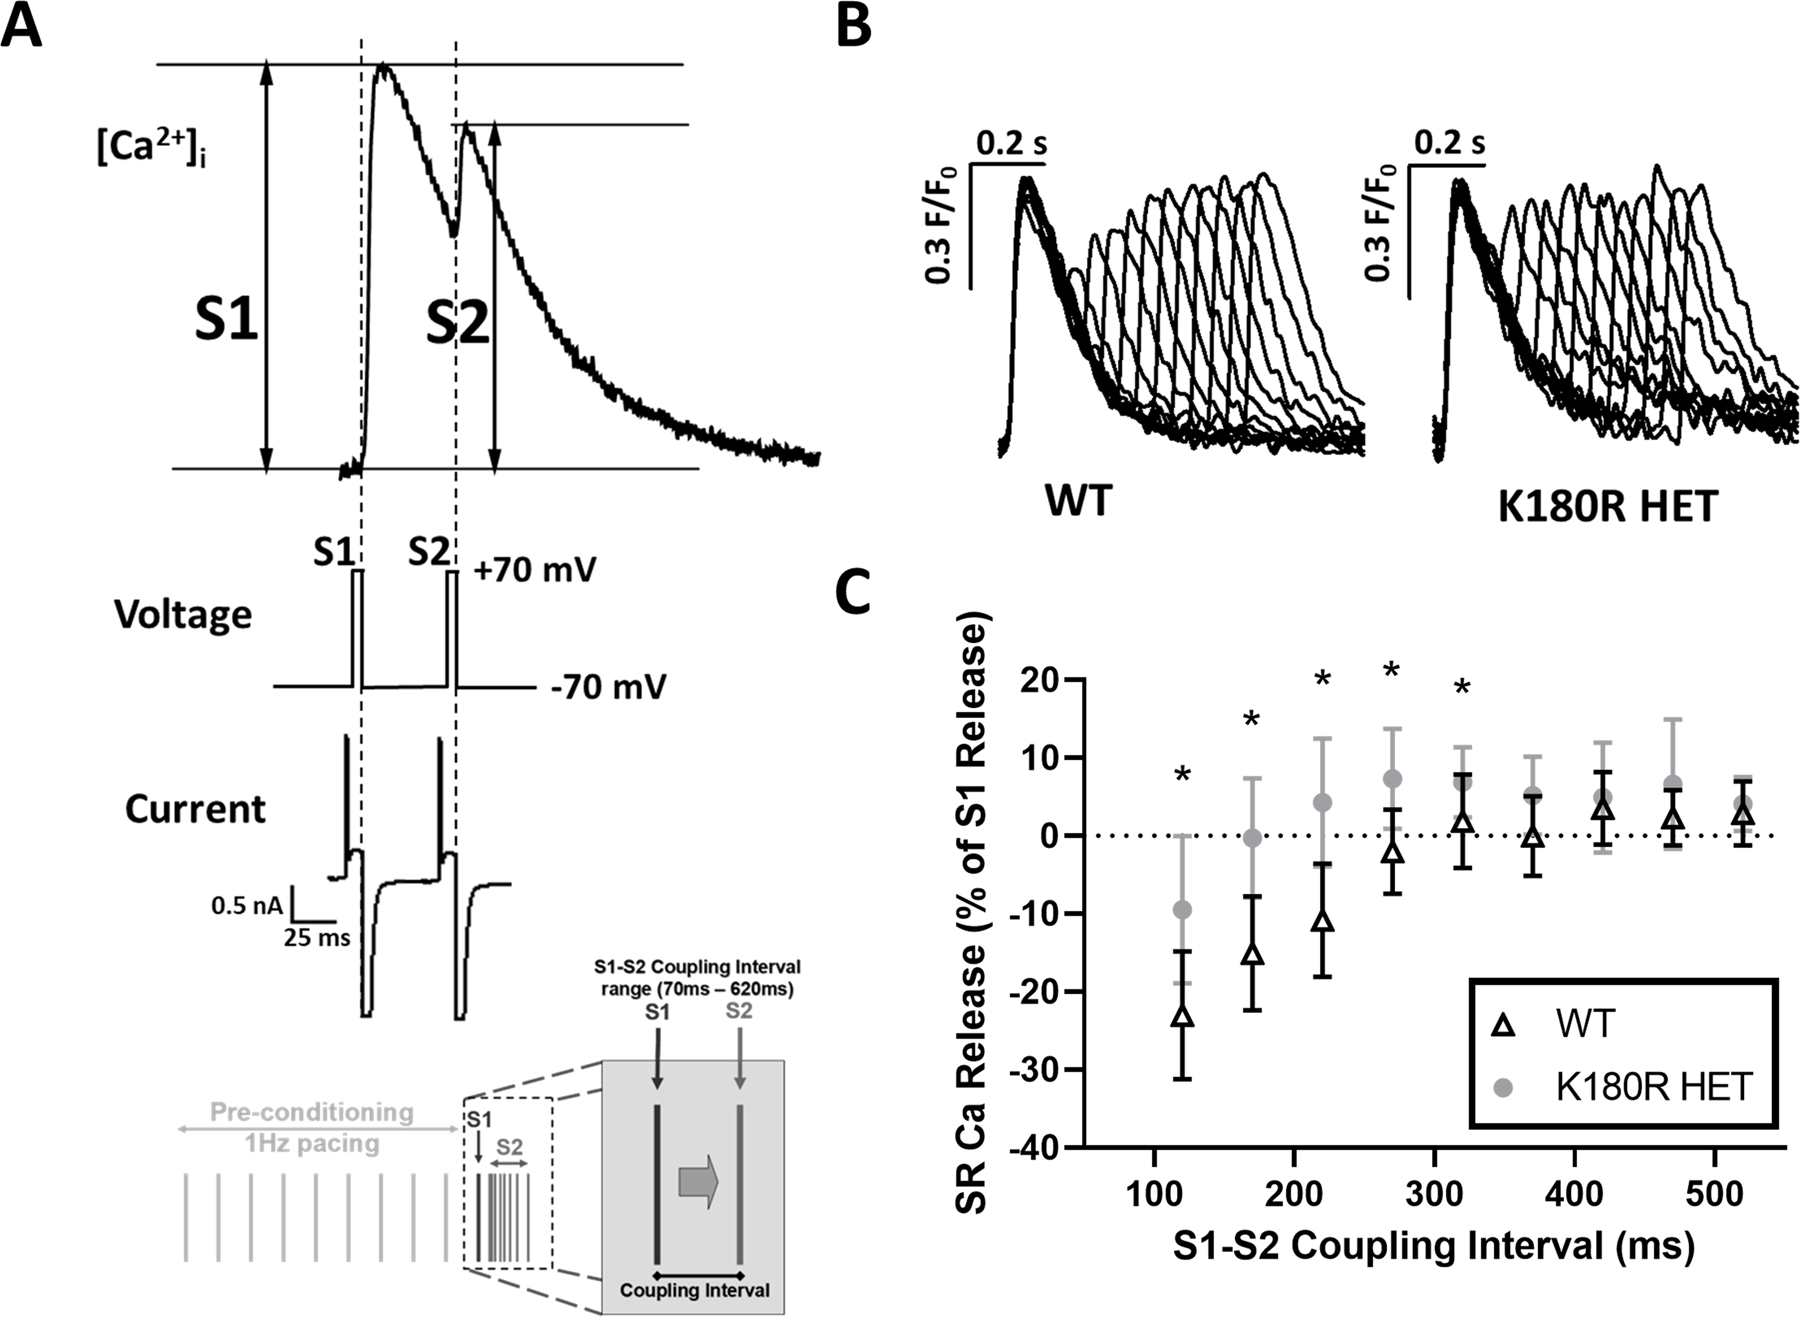
Figure 6: SR Ca release refractoriness is impaired in K180R cardiomyocytes.

To measure the refractoriness of SR Ca release, isolated cardiomyocytes were loaded with the Ca indicator fluo-4, patched in voltage clamp mode, and a voltage stimulation protocol used as shown in bottom of panel A. Isoproterenol was not used in this experiment. SR Ca release was triggered by L-type Ca tail currents elicited by stepping membrane potential from +70 to −70mV. A. Example [Ca]i fluorescent trace, voltage protocol, and membrane currents elicited during the S1 and S2 voltage step, illustrating how S1 and S2 transient amplitudes were calculated following the restitution protocol. B. Representative Ca transients for WT and K180R HET cells. Traces were normalized to the amplitude of the first peak (S1) and superimposed. C. Average S2 SR Ca release fraction plotted as a function of varying the S1–S2 coupling interval. WT n = 8 cells from 3 hearts; K180R HET n = 10 cells (9 at 120 ms) from 3 hearts. Data displayed as mean ± SD. Data was analyzed using a hierarchical statistical model with Bonferroni correction. *P-values = 0.0039, 0.00034, 0.00041, 0.0026, and 0.045, respectively.
