
Figure 7: K180R decreases dynamic SR Ca buffering without affecting steady-state SR Ca buffering.
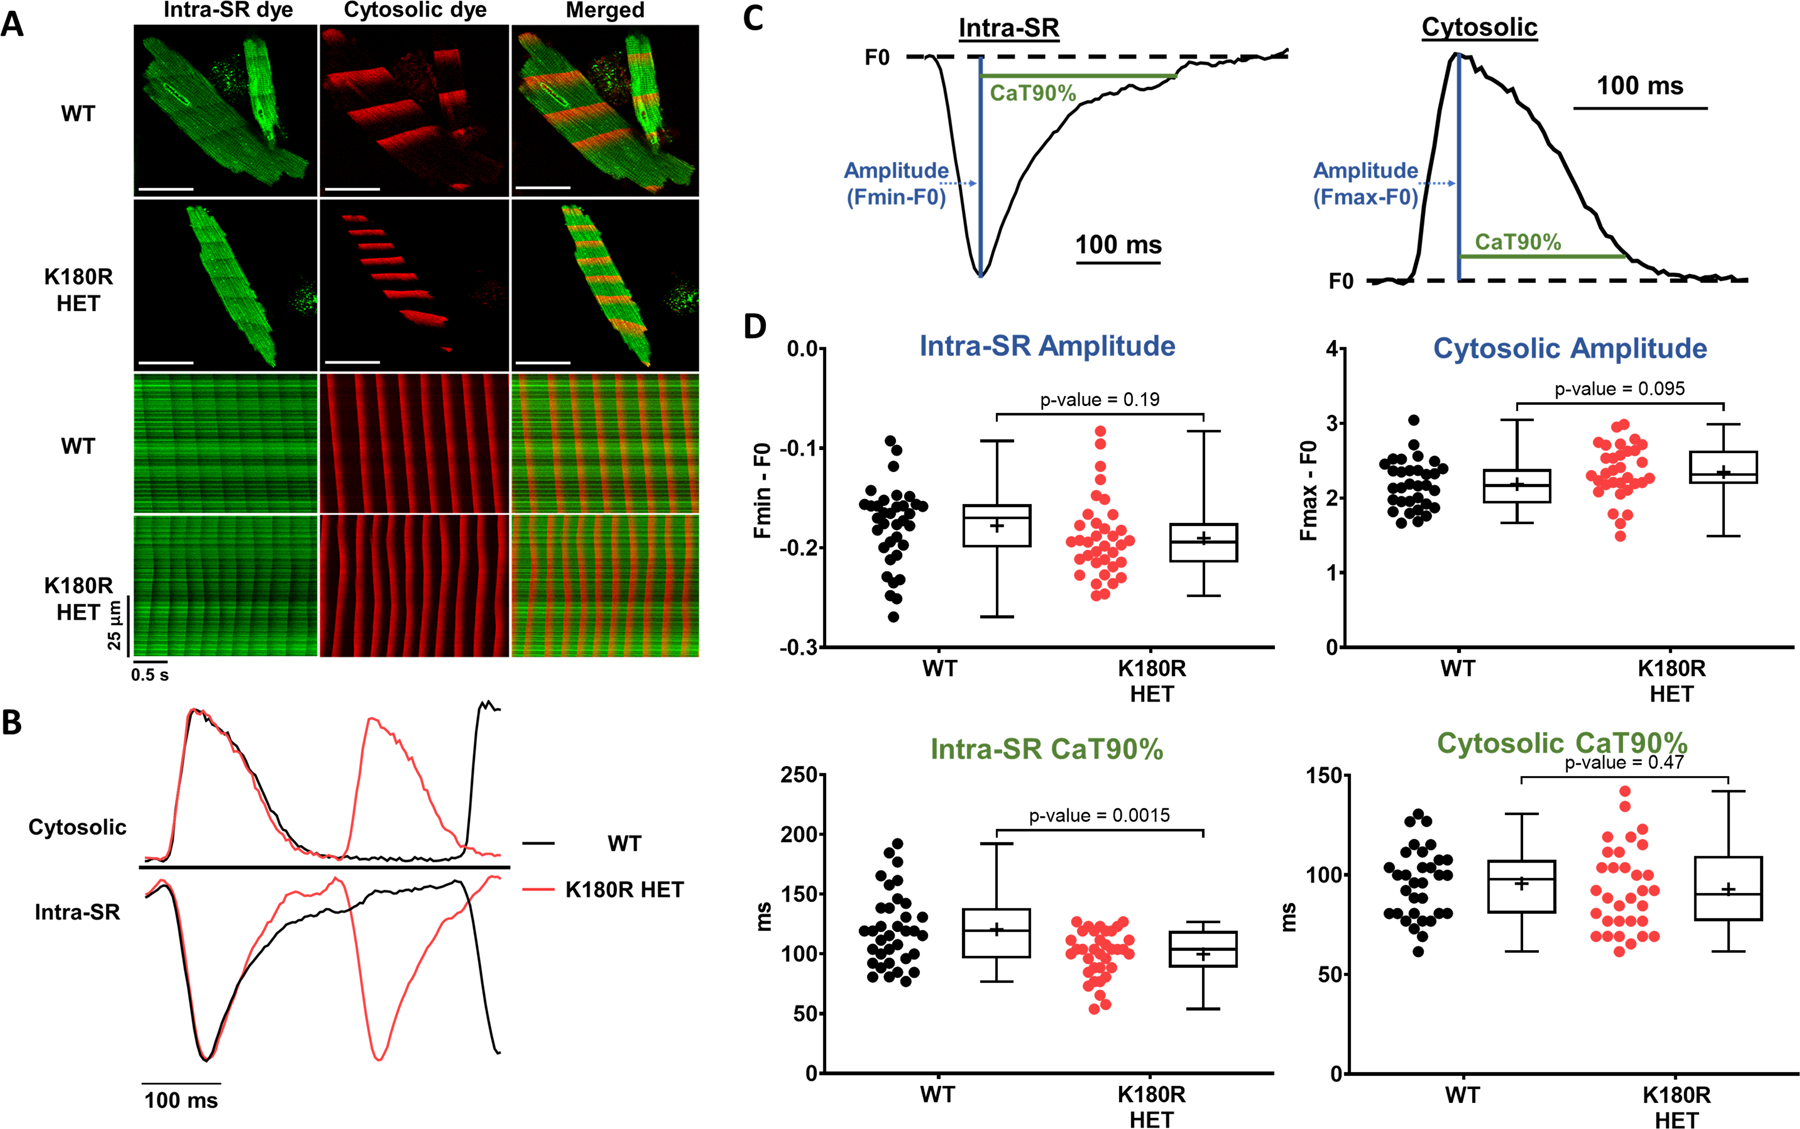
Cytosolic and intra-SR free Ca was measured simultaneously using a dual-indicator approach. Briefly, cardiomyocytes were first loaded with an esterified low-affinity Ca indicator that accesses the SR (Calbryte-520L AM). Cells were then permeabilized and loaded with the high-affinity Ca indicator Calbryte-590, potassium salt, to measure cytosolic Ca levels. Cells were imaged using an inverted confocal microscope in line-scan mode. A. Top: Representative images of indicator loading and wave propagation in permeabilized cardiomyocytes. Bottom: Example line scan images for SR and cytosolic fluorescent Ca indicators during Ca waves. Scale bar = 50 µm. B. Representative example trace of fluorescent signals generated from the line scans, illustrating the faster rise of intra-SR Ca in K180R HET cardiomyocytes. C. To compare Ca dynamics between groups, cytosolic Ca transients and intra-SR Ca depletion transients were parameterized by the transient amplitude and time to 90% recovery (CaT90%). D. Summary data of Ca dynamics. Intra-SR data: WT n = 34 cells from 3 hearts; K180R HET n = 35 cells from 3 hearts. Cytosolic data: WT n = 31 cells from 3 hearts for; K180R HET n = 32 cells from 3 hearts. Data reported as mean ± SD. Data analyzed using a hierarchical statistical model with Bonferroni correction.