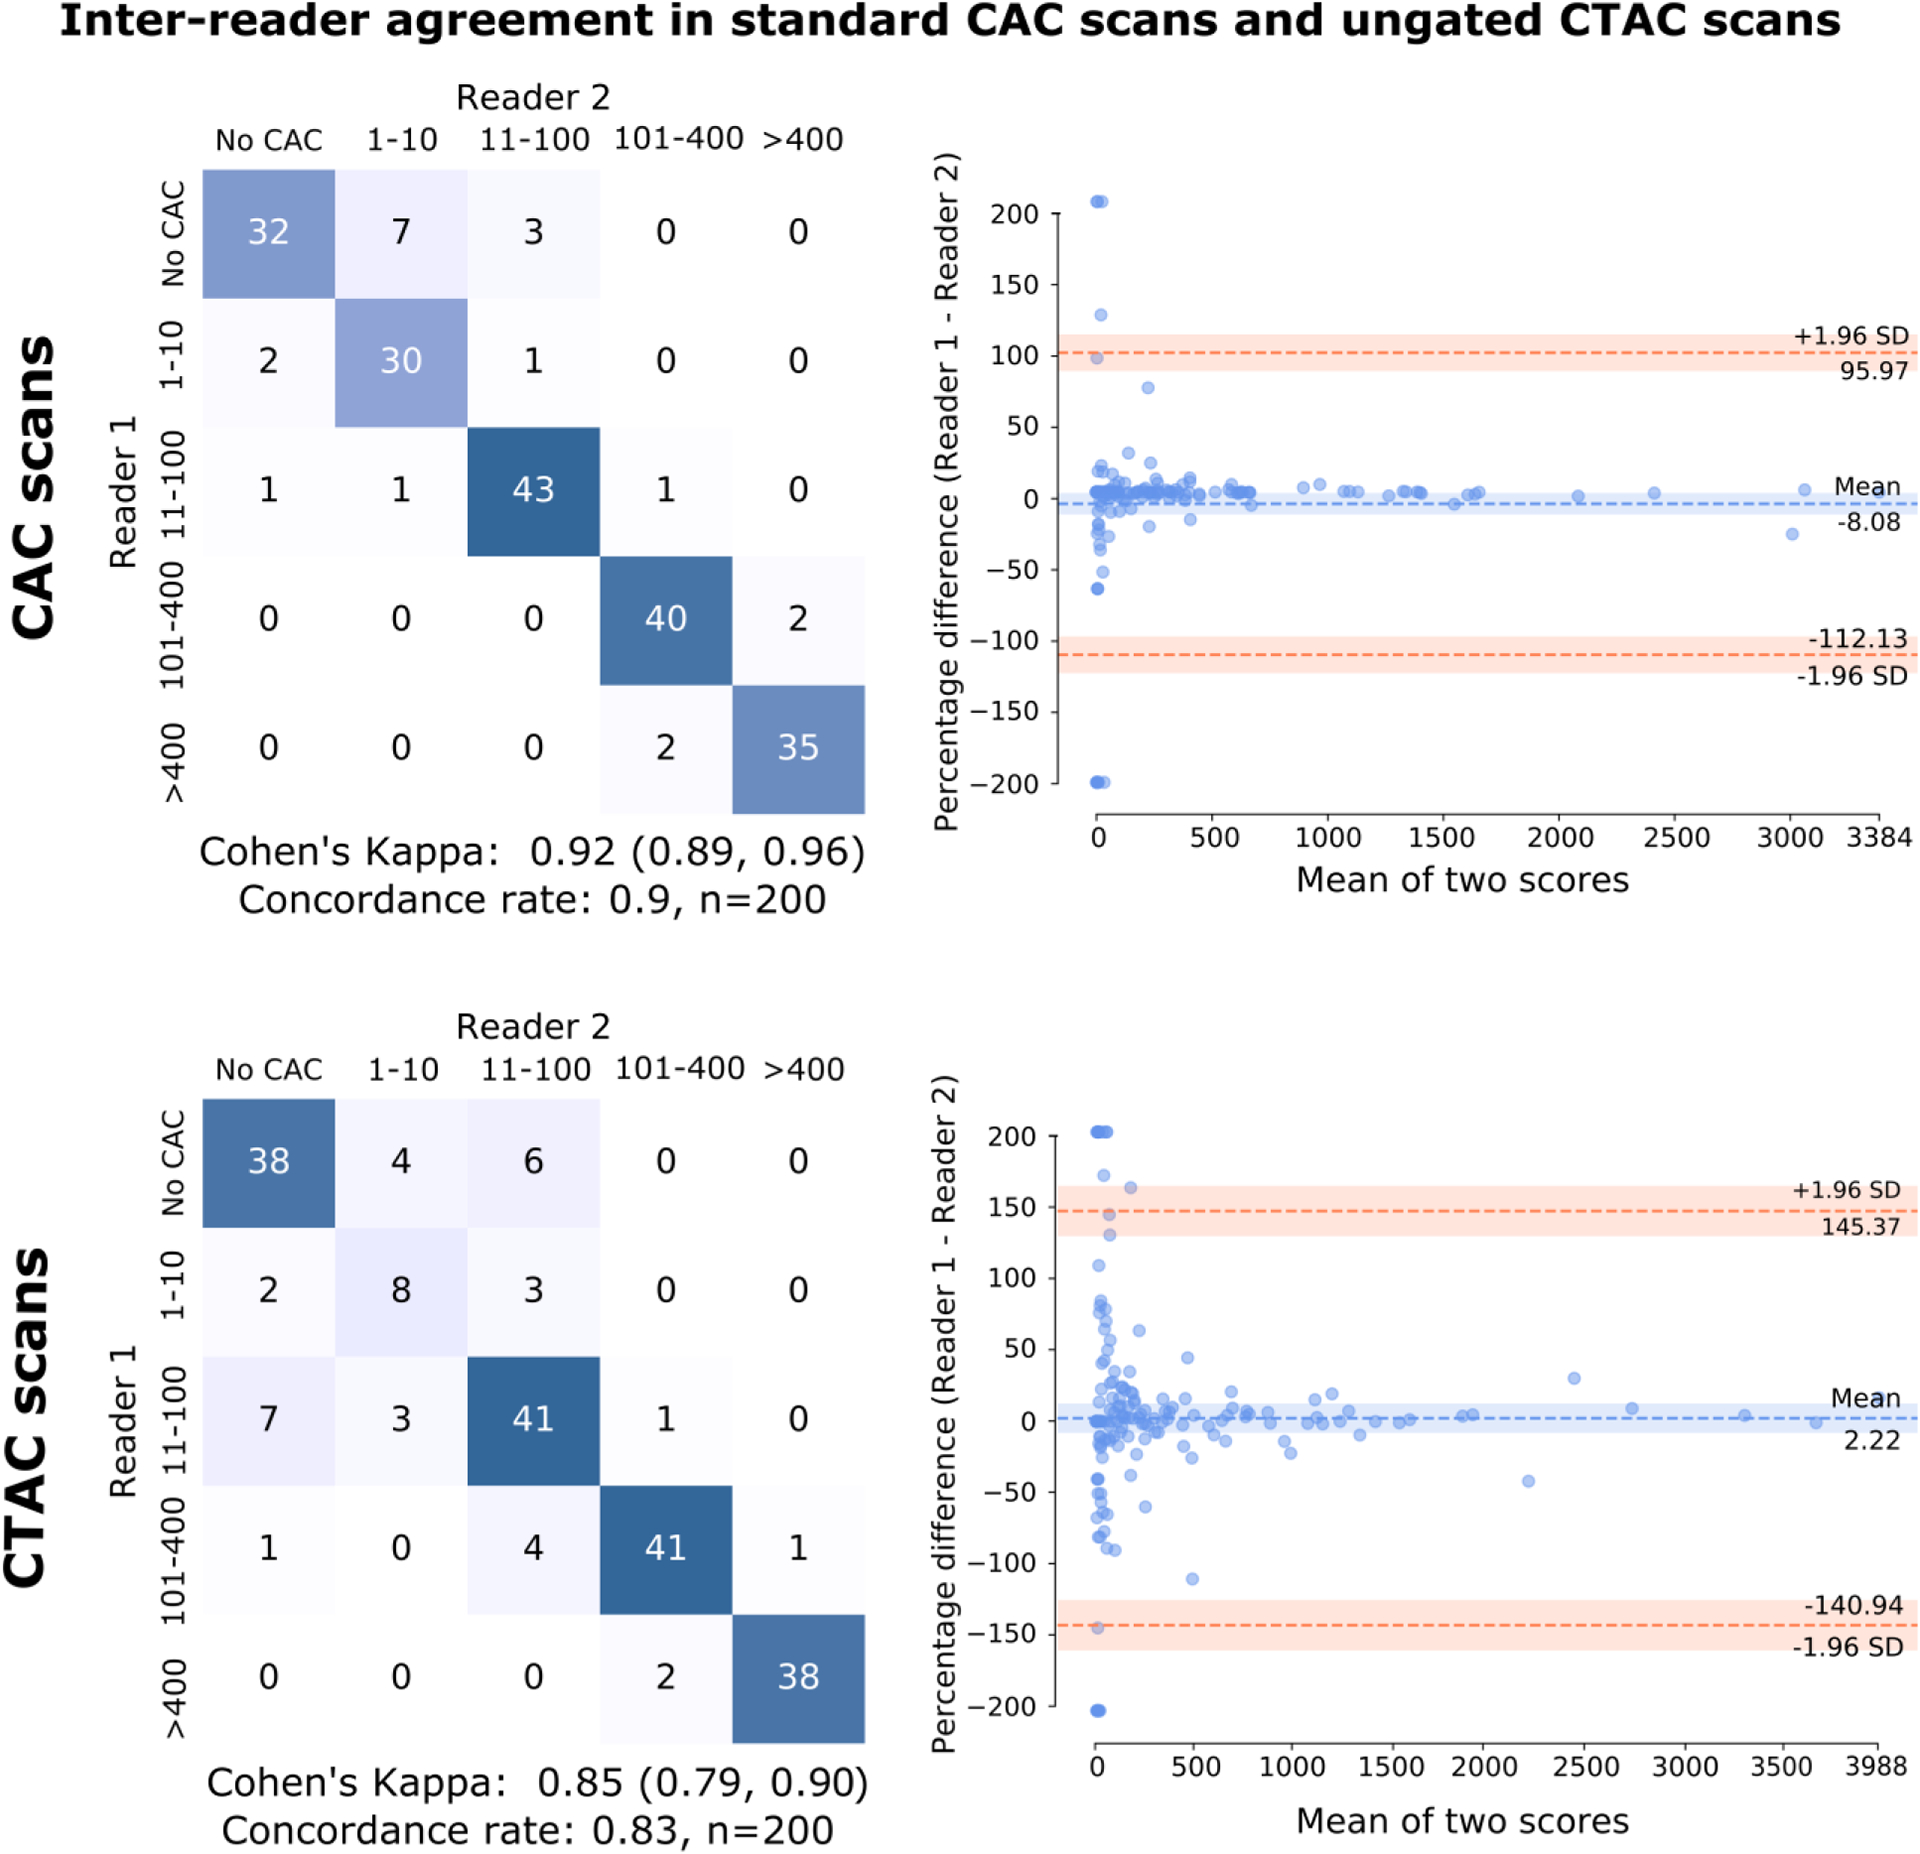
Fig. 3.

Inter-reader concordance matrices and Bland-Altman plots for ECG-gated CAC scans and ungated CTAC scans. Bland-Altman plots are composed using the percentage of difference vs. mean to better illustrate the agreement in clinically important low-calcium ranges. CAC categories: No CAC: 0, Very Low: 1–10, Low: 11–100, Moderate: 101–400, High: >400; CAC – coronary artery calcium, CTAC – computed tomography attenuation correction
