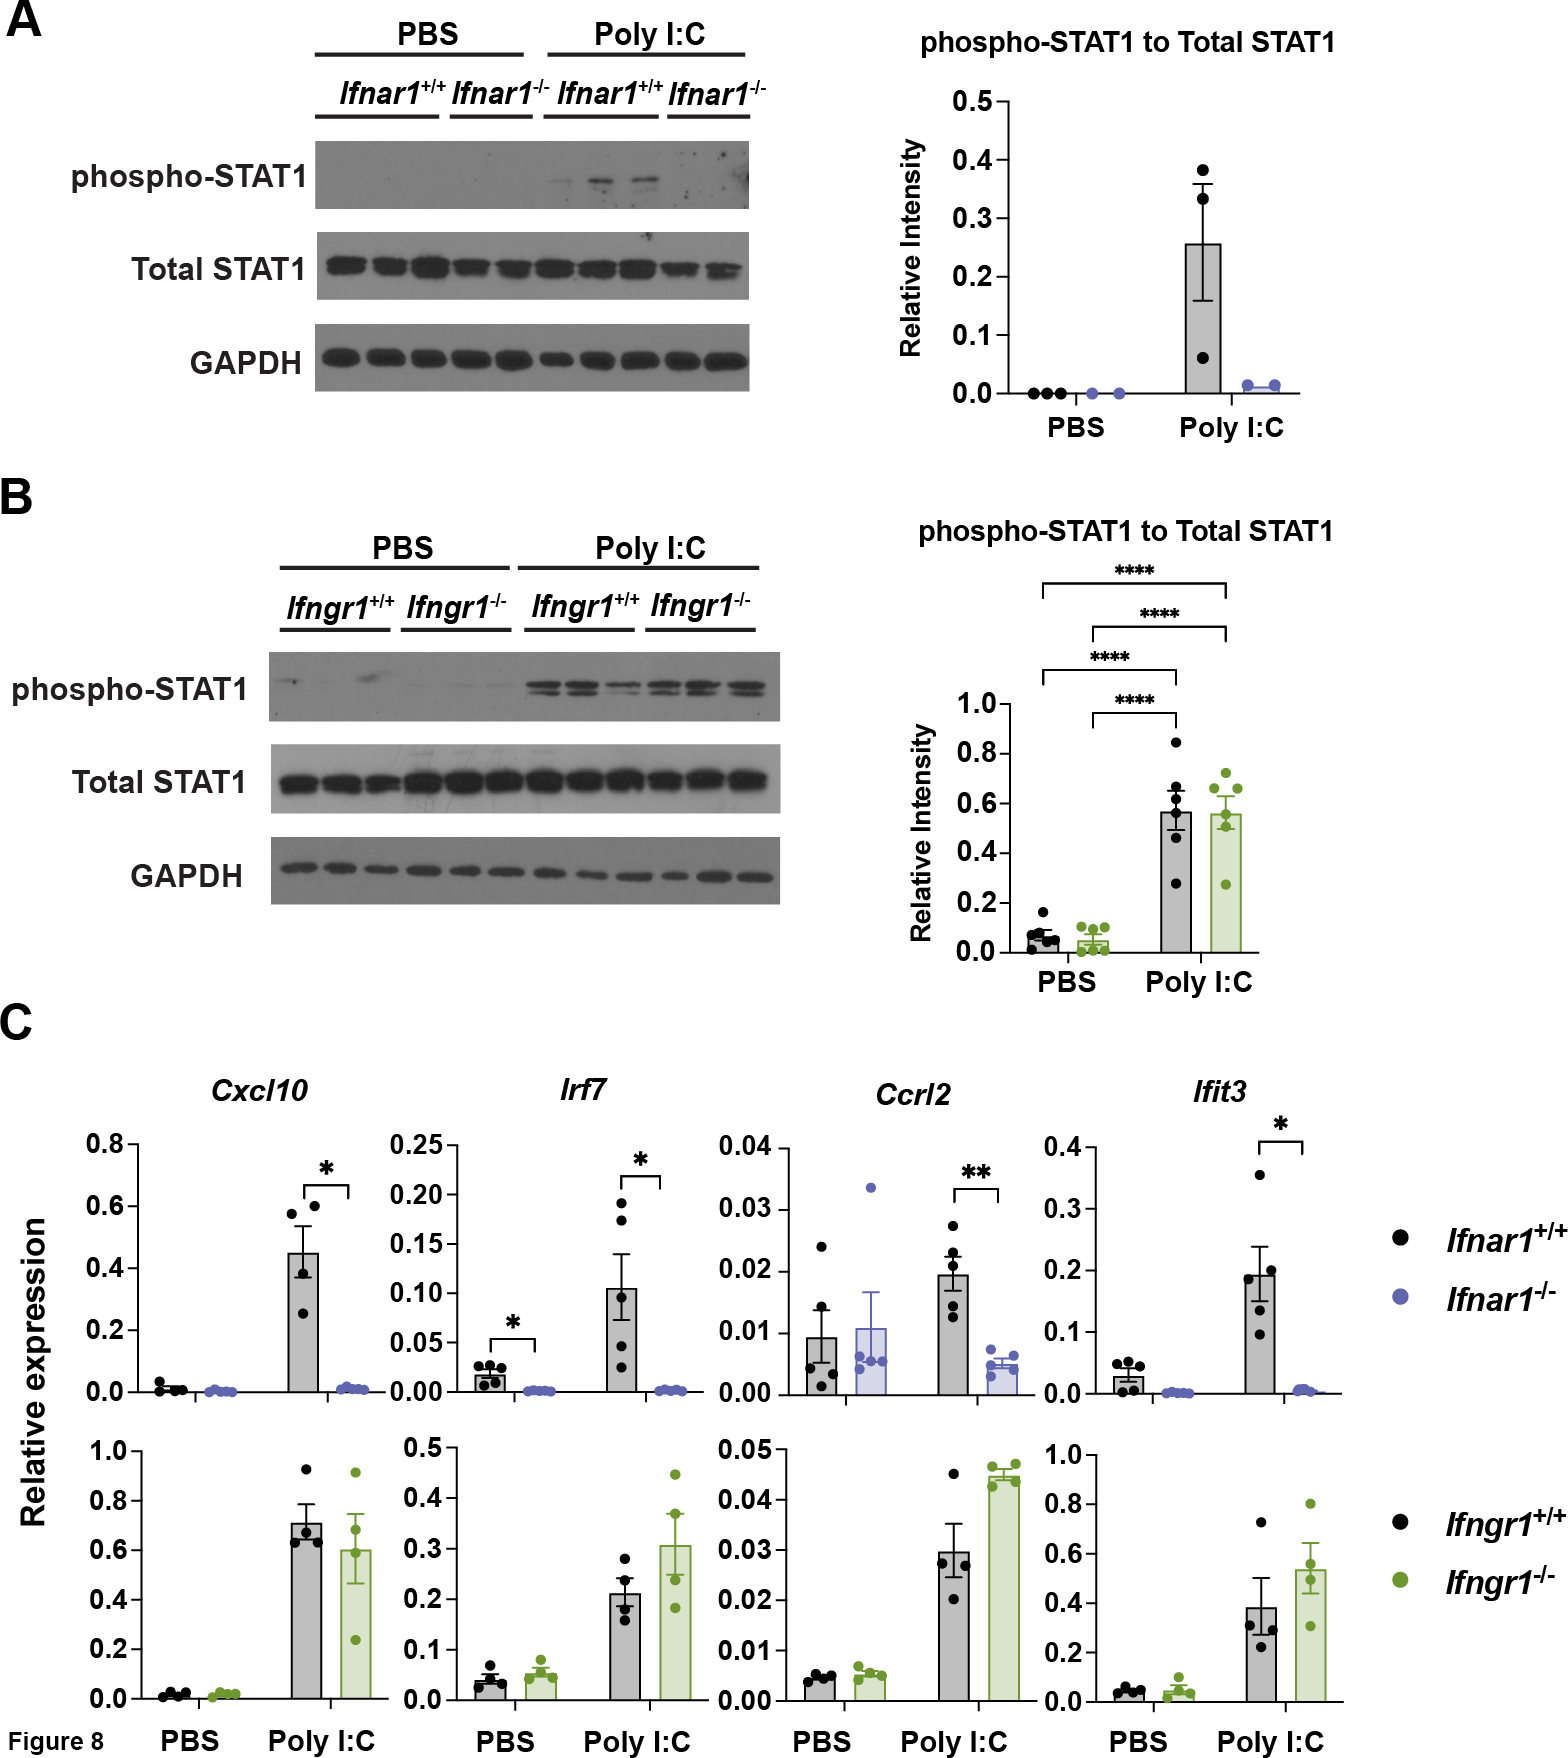
Figure 8. Ifnar1-dependent signaling and ISG induction in poly I:C-treated cDC1s.

Ifnar1+/+, Ifnar1−/−, Ifngr1+/+ and Ifngr1−/− cDC1s were treated with poly I:C or PBS for 6 hours. (A and B) Whole cell lysates were subjected to immunoblotting for pSTAT1, total STAT1, or GAPDH. (A) Representative immunoblot results (left) for the indicated proteins in Ifnar1+/+ and Ifnar1−/− cDC1s, and quantification by densitometry (right) from 1 of 2 independent experiments, n = 3 (Ifnar1+/+), n = 2 (Ifnar1−/−). (B) Representative immunoblot (left) for the indicated proteins in Ifngr1+/+ and Ifngr1−/− cDC1s, or cumulative data quantified by densitometry (right) from 2 independent experiments, n = 6 per genotype and condition. (C) Relative transcript expression of the indicated genes, as determined by qRT-PCR. Data combined from 2 independent experiments, n = 5 (Ifnar1+/+, Ifnar1−/−), n = 4 (Ifngr1+/+, Ifngr1−/−). * p < 0.05, ** p < 0.01, **** p < 0.0001.
