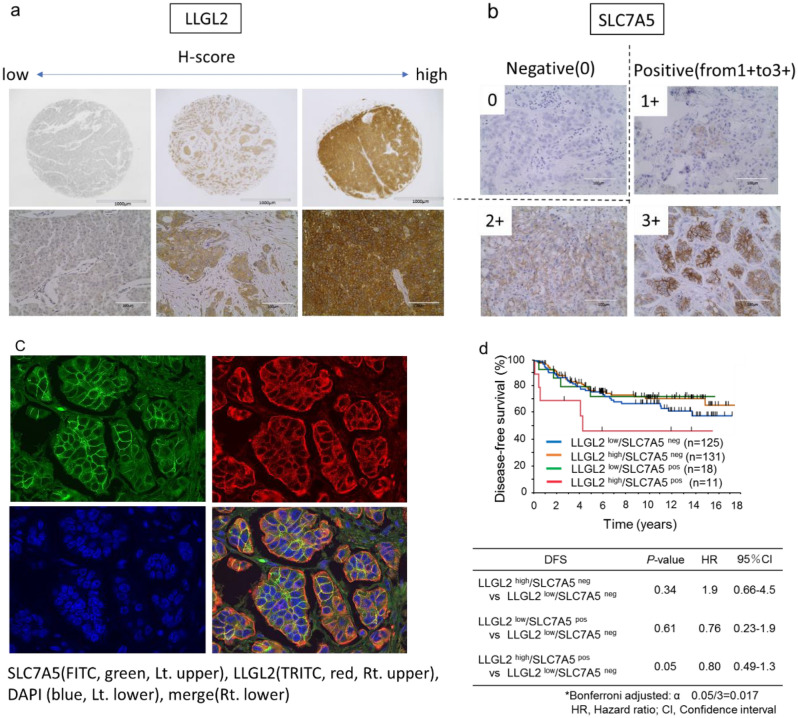
Figure 3.
Representative images of LLGL2 protein expression in breast cancer tissues. H-score: 0, 90, and 270 from the left (a). Representative images of SLC7A5 protein expression in breast cancer tissues. 0 is negative and 1+ to 3+ is positive (b). Immunofluorescence staining for LLGL2 and SLC7A5. SLC7A5 (FITC, green, lt. upper), LLGL2 (TRITC, red, rt. upper), DAPI (blue, lt. lower), and merge (rt. lower) (c). Kaplan–Meier survival curves of DFS according to the combination of LLGL2 and SLC7A5 protein expression (d).

