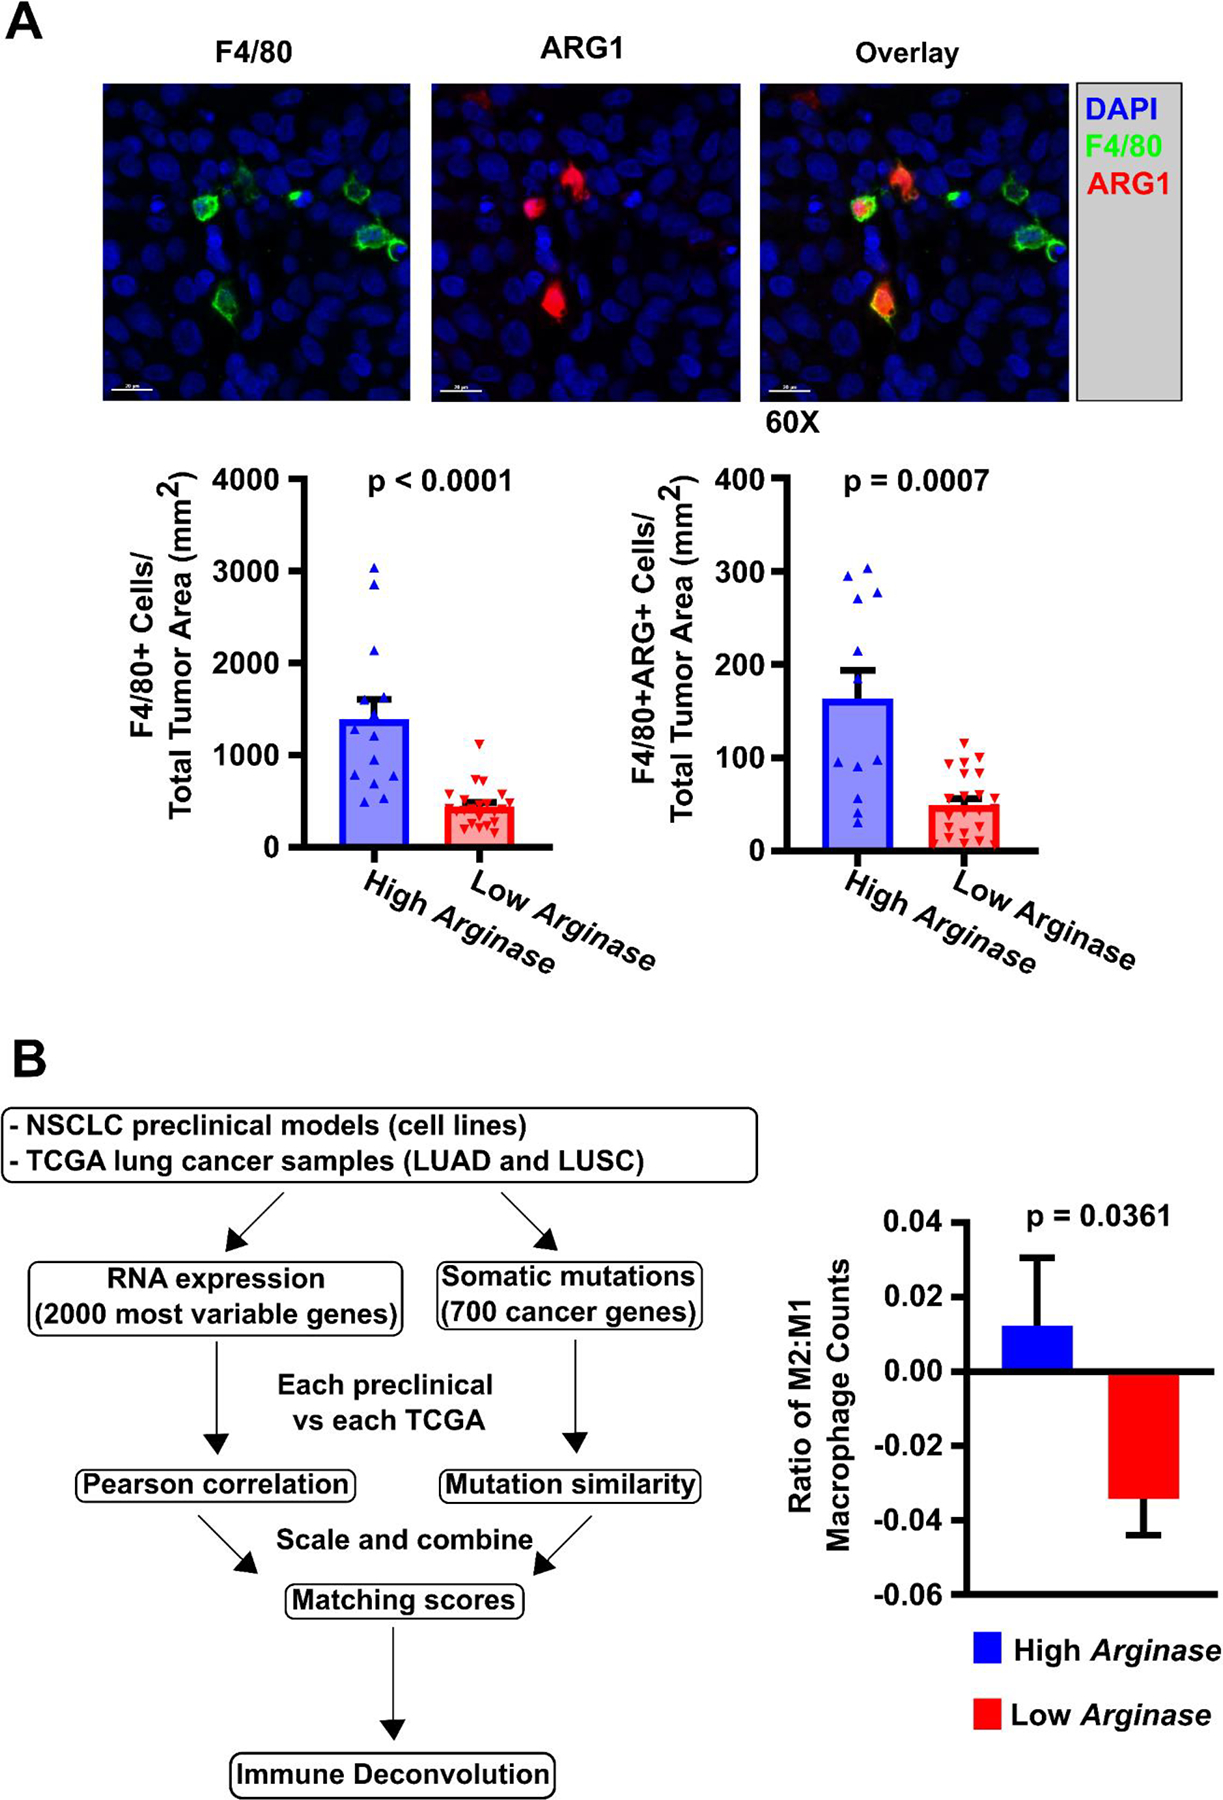
Figure 3: Macrophage phenotype induced in vitro are observed in vivo and in clinical samples from the TCGA.

A) Immunohistochemical staining of NSCLC xenografts for macrophage markers. NSCLC xenografts were established from 5 Arghi cluster lines (A427, H1373, H1666, H2009, H522) and 6 Arglow cluster lines (H1993, Calu-6, H460, H647, H2073, H441) using athymic nude mice with subcutaneously injected tumor cells (1×10⁶ cells/mouse) into the right flank to investigate induced macrophage phenotype in vivo (2–7 mice/NSCLC line). As an example, NSCLC xenograft NCI-H2073 was sectioned, immunohistochemically stained, and quantified for macrophage ARG1 expression. F4/80 was used as a co-localizing murine pan-macrophage marker, while staining for human pan-cytokeratin identified epithelial tumor cells. Those xenografts established from Arghi cluster lines had significantly median greater density of total F4/80+ macrophages and ARG+ macrophages. This was consistent with prior qRT-PCR mRNA macrophage expression results from the in vitro co-cultures. Significance was determined using Mann-Whitney U tests between cohorts. B) M2-macrophage phenotype found in NSCLC TCGA data by CIBERSORT analysis correlate with matched NSCLC line-induced macrophage phenotypes. B (left portion): Our NSCLC cell lines were matched to TCGA clinical samples through assessment of RNA expression and mutational profiles to generate a matching score between an individual NSCLC cell line and a “matched” TCGA patient sample (see Supplemental Methods: TCGA Matchup) 36 molecular matches were established. B (right portion): A significantly higher M2:M1 ratio of macrophages was identified through immune deconvolution (CIBERSORT) of TCGA patient data derived from samples that were “matched” (by mRNA expression and DNA mutation profiles) to NSCLC cell lines from the Arghi cluster. Significance was determined using a two-sided T-test. Mean ± SD.
