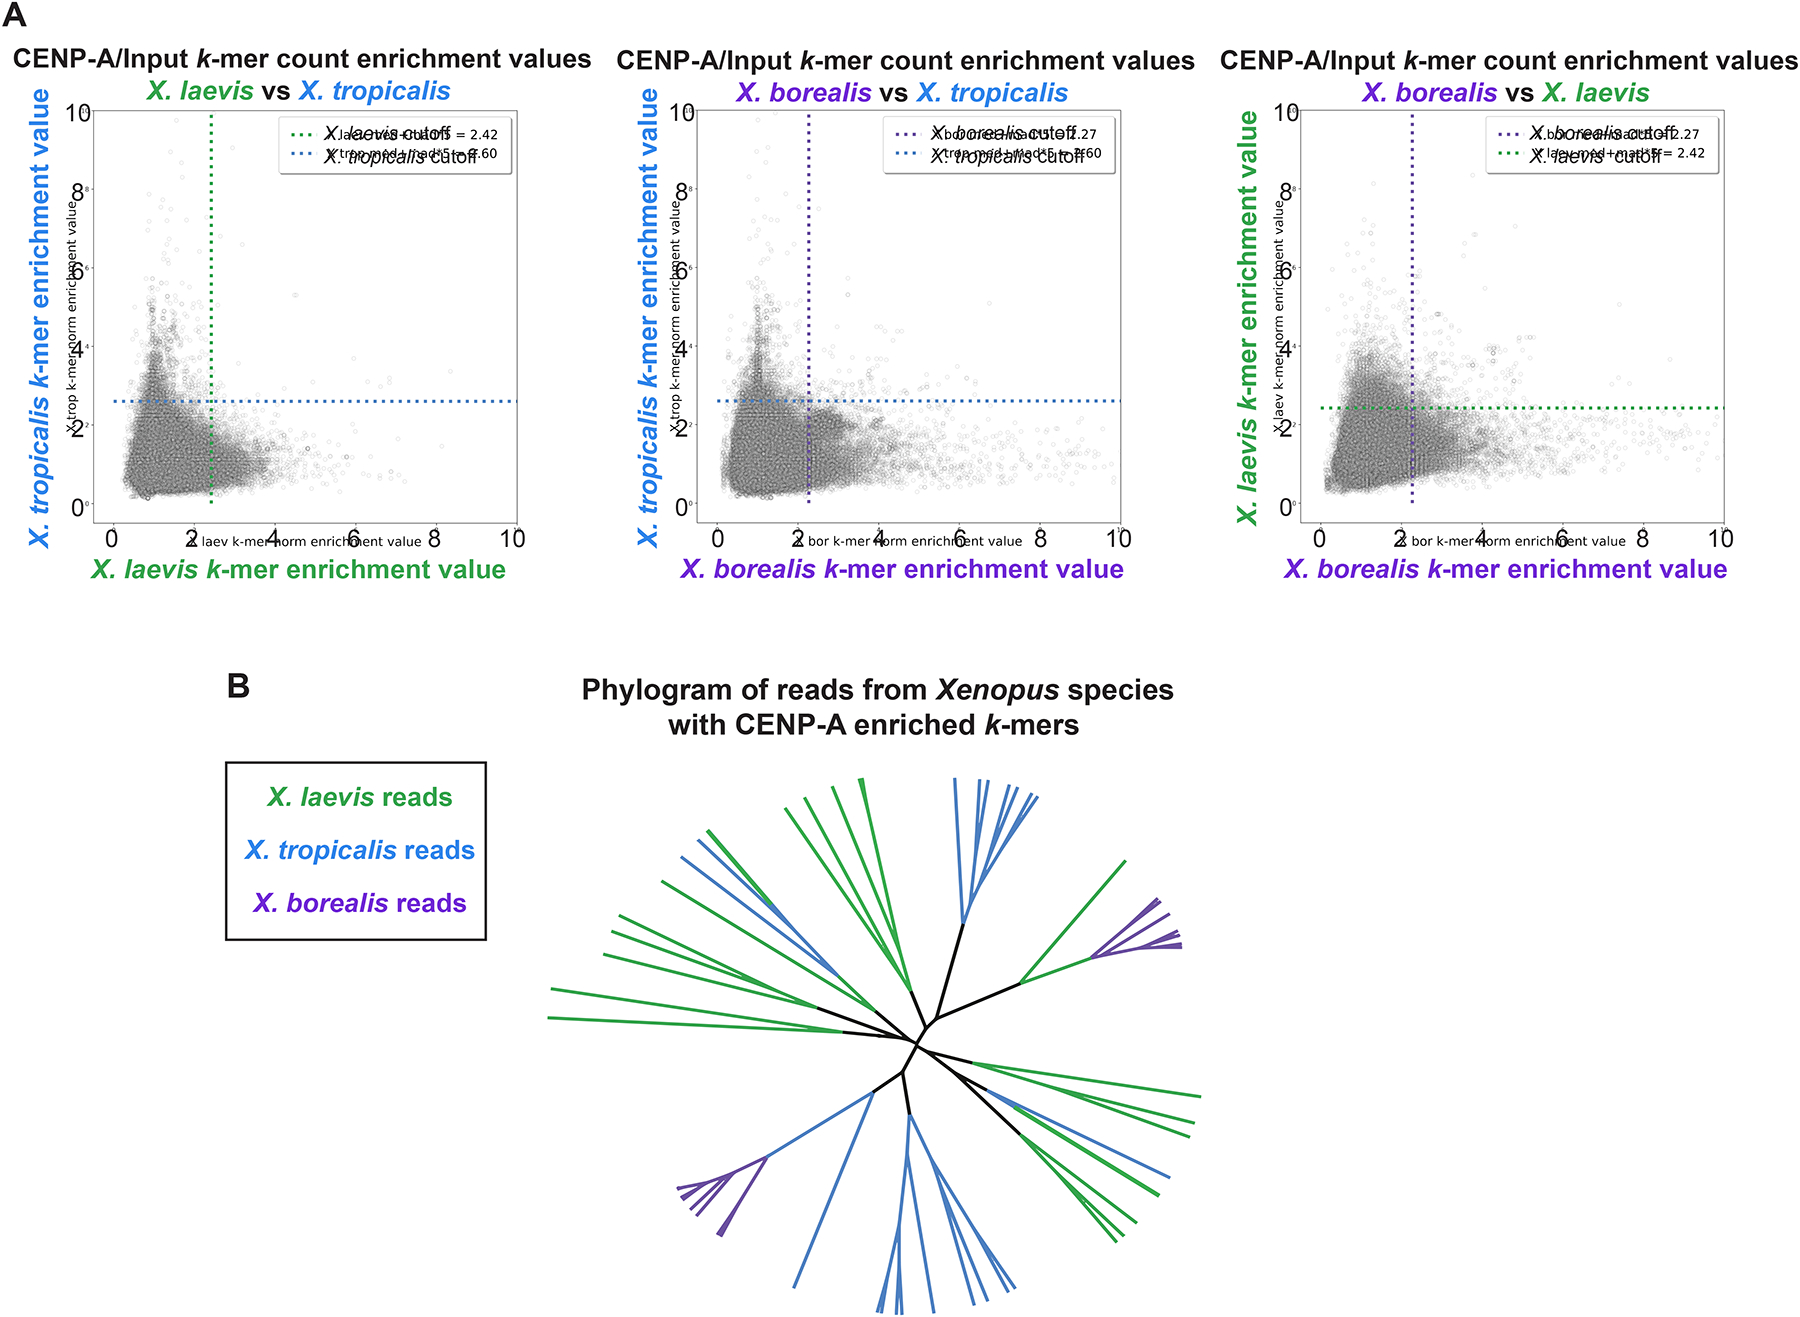
Figure 1: Comparison of X. laevis, X. tropicalis, and X. borealis core centromere sequences.

(A) Scatter plots of k-mer enrichment values (normalized CENP-A counts / normalized input counts) compared between species. Only k-mers found in both species are plotted. Dotted lines indicate enrichment value for each species that is five median absolute deviations above the median enrichment value to denote highly enriched k-mers, which are not well conserved across species.
(B) Phylogram of full-length sequencing reads from each Xenopus species. Branches are colored according to species of origin. Sequencing reads were selected first by the presence of at least 80 CENP-A enriched 25bp k-mers and then by hierarchical clustering. The phylogram illustrates a striking divergence of core centromere sequences.
See also Figure S1.
