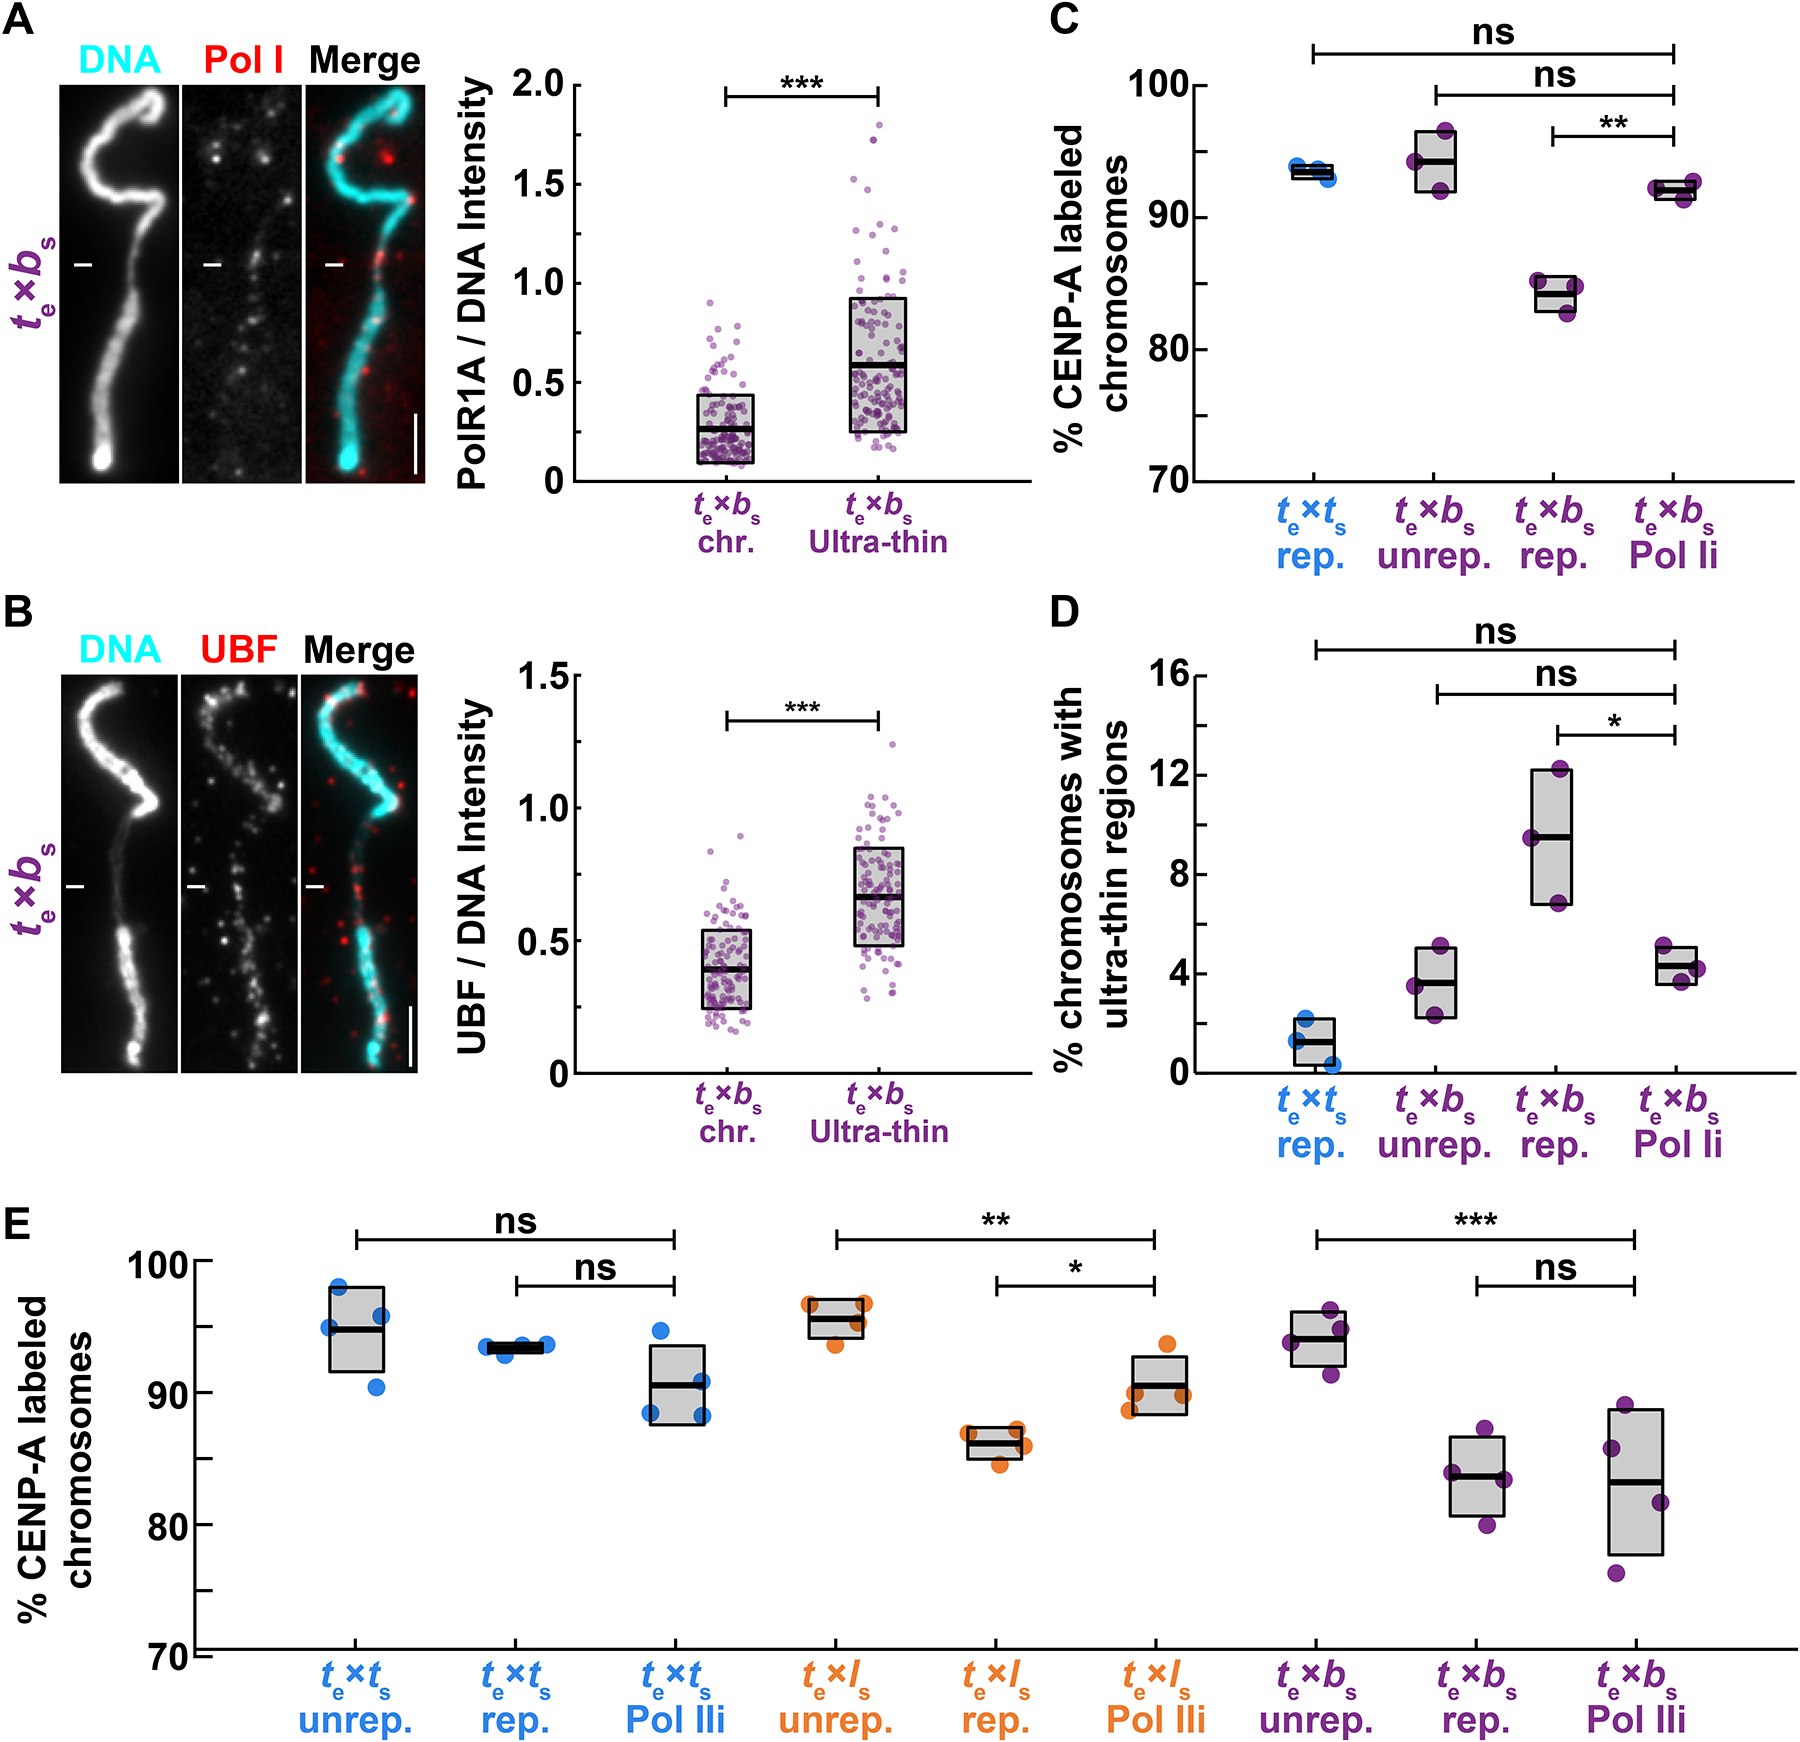
Figure 5: Replication-transcription conflicts at rDNA on X. borealis chromosomes can be rescued by inhibiting RNA Pol I.

(A) Representative images and fluorescence intensity quantification of RNA Pol I staining relative to DNA on ultrathin and normal regions of X. borealis mitotic chromosomes, revealing enrichment of Pol I on ultra-thin regions. Quantification with N = 3 extracts, N = 140 chromosomes. p-value = 9.4793e-20 by two-tailed two-sample unequal variance t-tests.
(B) Representative images and fluorescence intensity quantification of UBF staining relative to DNA on ultrathin and normal regions of X. borealis mitotic chromosomes, revealing enrichment of UBF on ultra-thin regions. Quantification with N = 3 extracts, N = 62 chromosomes. p-value = 4.5004e-13 by two-tailed two-sample unequal variance t-tests.
(C) Percentage of mitotic chromosomes with centromeric CENP-A staining in X. tropicalis extracts treated with solvent control or 1 μM BMH-21 to inhibit RNA Pol I (Pol Ii), which fully rescues CENP-A localization on replicated X. borealis chromosomes. p-values (top to bottom) by one-way ANOVA with Tukey post-hoc analysis: 0.9794, 0.7979, 0.0005.
(D) Percentage of mitotic chromosomes with ultrathin regions in X. tropicalis extracts treated with solvent control or 1 μM BMH-21 (Pol Ii). Pol I inhibition also rescues X. borealis chromosome morphology defects. p-values (top to bottom) by one-way ANOVA with Tukey post-hoc analysis: 0.5078, 0.9999, 0.0469.
(E) Percentage of chromosomes with centromeric CENP-A staining in X. tropicalis extracts treated with solvent control or 25 μM triptolide to inhibit RNA Pol II (Pol IIi). X. laevis chromosomes are partially rescued, while X. tropicalis and X. borealis chromosomes are not affected. Quantification with N = 3 extracts, N > 322 chromosomes per extract. p-values (top to bottom, then left to right) by one-way ANOVA with Tukey post-hoc analysis: 0.4785, 0.8797, 0.0052, 0.0125, 0.0003, 0.9999.
A, B: DNA in cyan, Pol I in red. Scale bar is 5 μm.
C, D: N = 3 extracts, N > 172 chromosomes per extract.
C-E: ns, not significant.
See also Figure S5.
