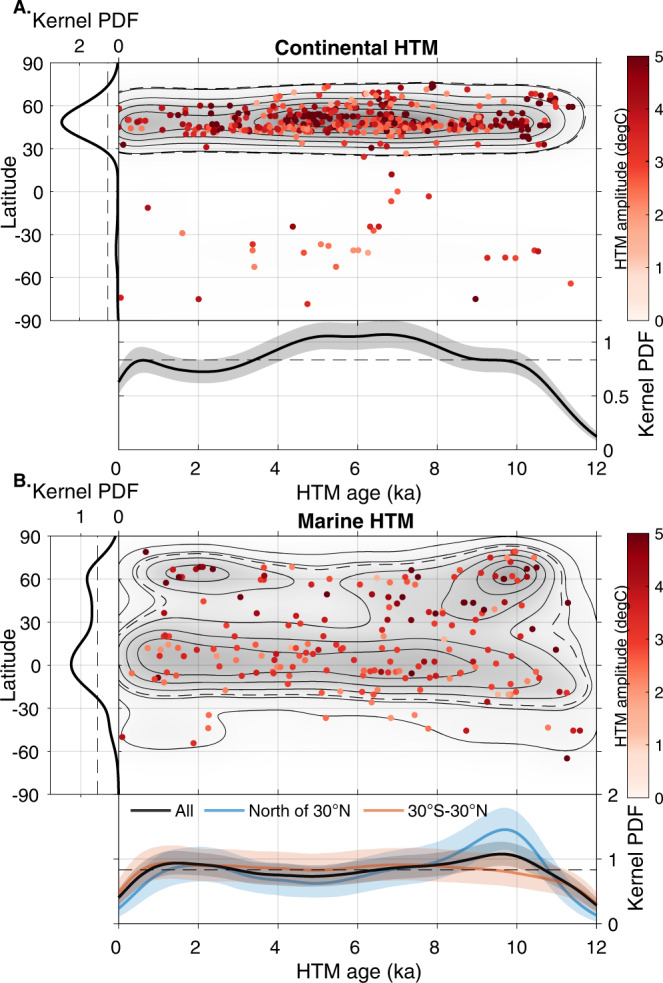
Fig. 1. Spatiotemporal structure of the Holocene Thermal Maximum.

Spatiotemporal structure of the Holocene Thermal Maximum (HTM) derived from marine and continental temperature records. Dots represent median HTM age and median HTM amplitude (anomaly compared to mean Holocene temperatures) calculated from the age and temperature ensembles for each continental (A) and marine record (B). Gray shadings and contours depict the mean of 10,000 kernel probability density function maps (PDF; Gaussian kernel with a bandwidth of 10° in latitude and 500 years) calculated using the temperature and age model ensembles (see also Fig. 5 for contour label). Left and bottom panels correspond to median kernel probability density calculated against latitude (10° bandwidth) and age (500 years bandwidth), respectively for different subsets, with dashed straight lines corresponding to a homogenous distribution (color shading shows 10–90 percentiles).
