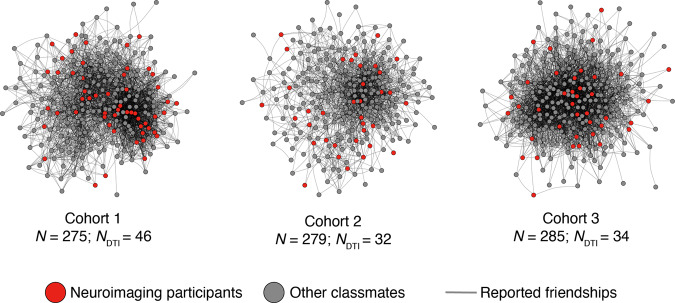
Fig. 1. Social network characterization.
Three cohorts of first-year graduate students completed a survey in which they indicated their social ties with other students. These three social networks were reconstructed using this data. Nodes indicate students and lines reflect mutually reported ties between students. Across all three cohorts, a subset of students (red nodes; N = 112 after exclusions; see Methods) participated in the dMRI study. The Fruchterman-Reingold layout algorithm, as implemented in the igraph package, was used to position the nodes.

