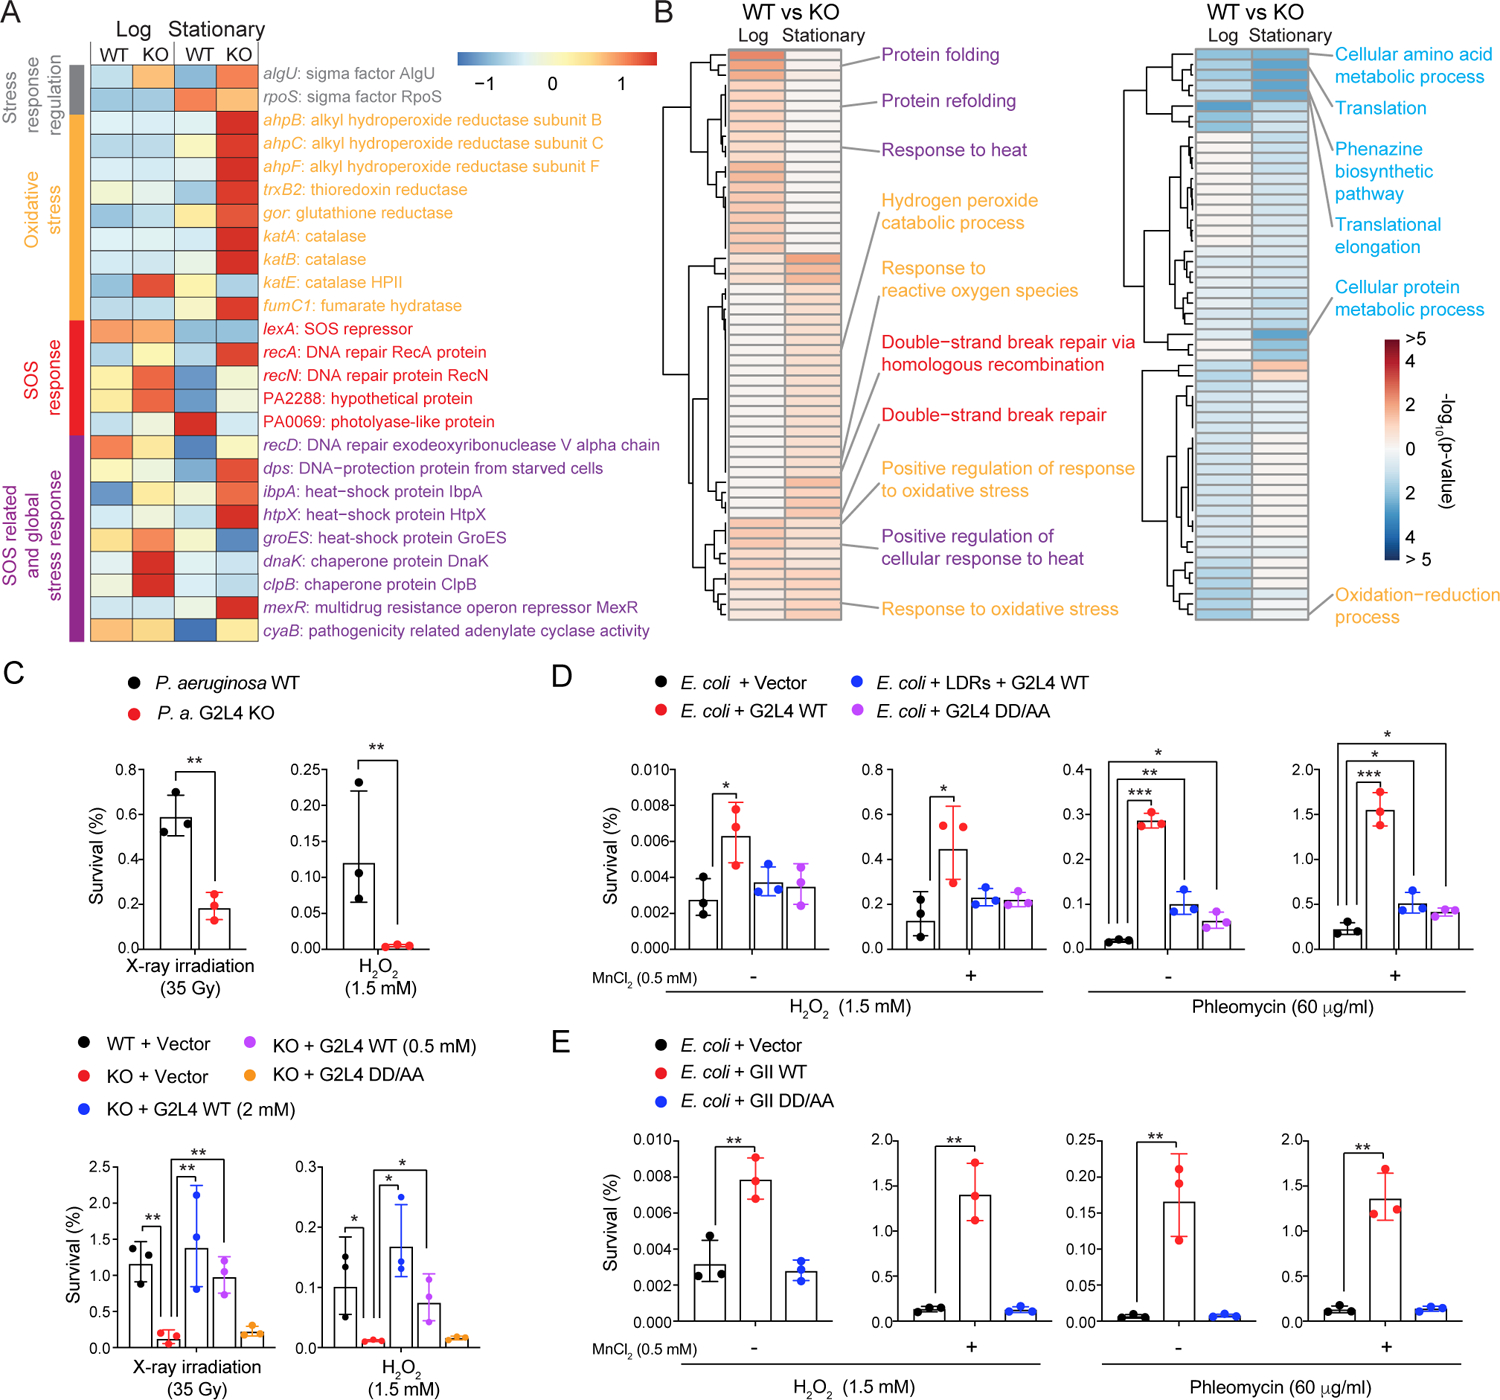
Figure 2. G2L4 and GII RT function in DNA repair in vivo.

(A) Heatmap of significantly up or down regulated cellular stress and DNA damage response genes in G2L4 RT KO versus WT strains of P. aeruginosa AZPAE12409 in log and stationary phase. The color scale is based on the Z score for the mean of the sample-medians of the four replicates divided by the standard deviation of the sample-medians. Normalized read counts are listed in the Supplemental File.
(B) Heatmap of significantly enriched GO terms among up regulated (left, red) and down regulated (right, blue) genes in G2L4 RT KO versus WT strains in log and stationary phase. The color scale shows the −log10(p-value) of enriched GO terms for genes that were significantly up- or down regulated (log2FC>0 or FC<0, respectively, adjusted p-value ≤0.05). p-values for enriched GO terms are listed in the Supplemental File.
(C) Survival of P. aeruginosa AZPAE12409 WT and KO strains after X-ray irradiation or H2O2 treatment without (top) or with (bottom) expression of WT or RT-deficient mutant DD/AA G2L4 RTs. WT G2L4 RT was expressed at two different concentrations of m-toluic acid (0.5 and 2 mM) to vary the protein expression level.
(D) Survival of E. coli HMS174 (DE3) expressing WT and DD/AA mutant G2L4 RTs after treatment with H2O2 or phleomycin compared to a vector control.
(E) Survival of E. coli HMS174 (DE3) expressing WT and DD/AA mutant GII RTs after treatment with H2O2 or phleomycin compared to a vector control.
Analyses in panels A and B were based on four TGIRT-seq datasets for each strain and condition. Survival assays were repeated three times, with the error bars indicating the standard deviation. p-values <0.05, *; <0.01, **; <0.001, ***.
